When asked about generating dynamic marathon route maps like those in Beijing Marathon 2024, I discovered MapPlus—a zero-code solution for creating animated race visualizations. This tool eliminates the need for custom development while producing professional-grade outputs.
Introducing MapPlus
Platform: https://www.mapplus.com/
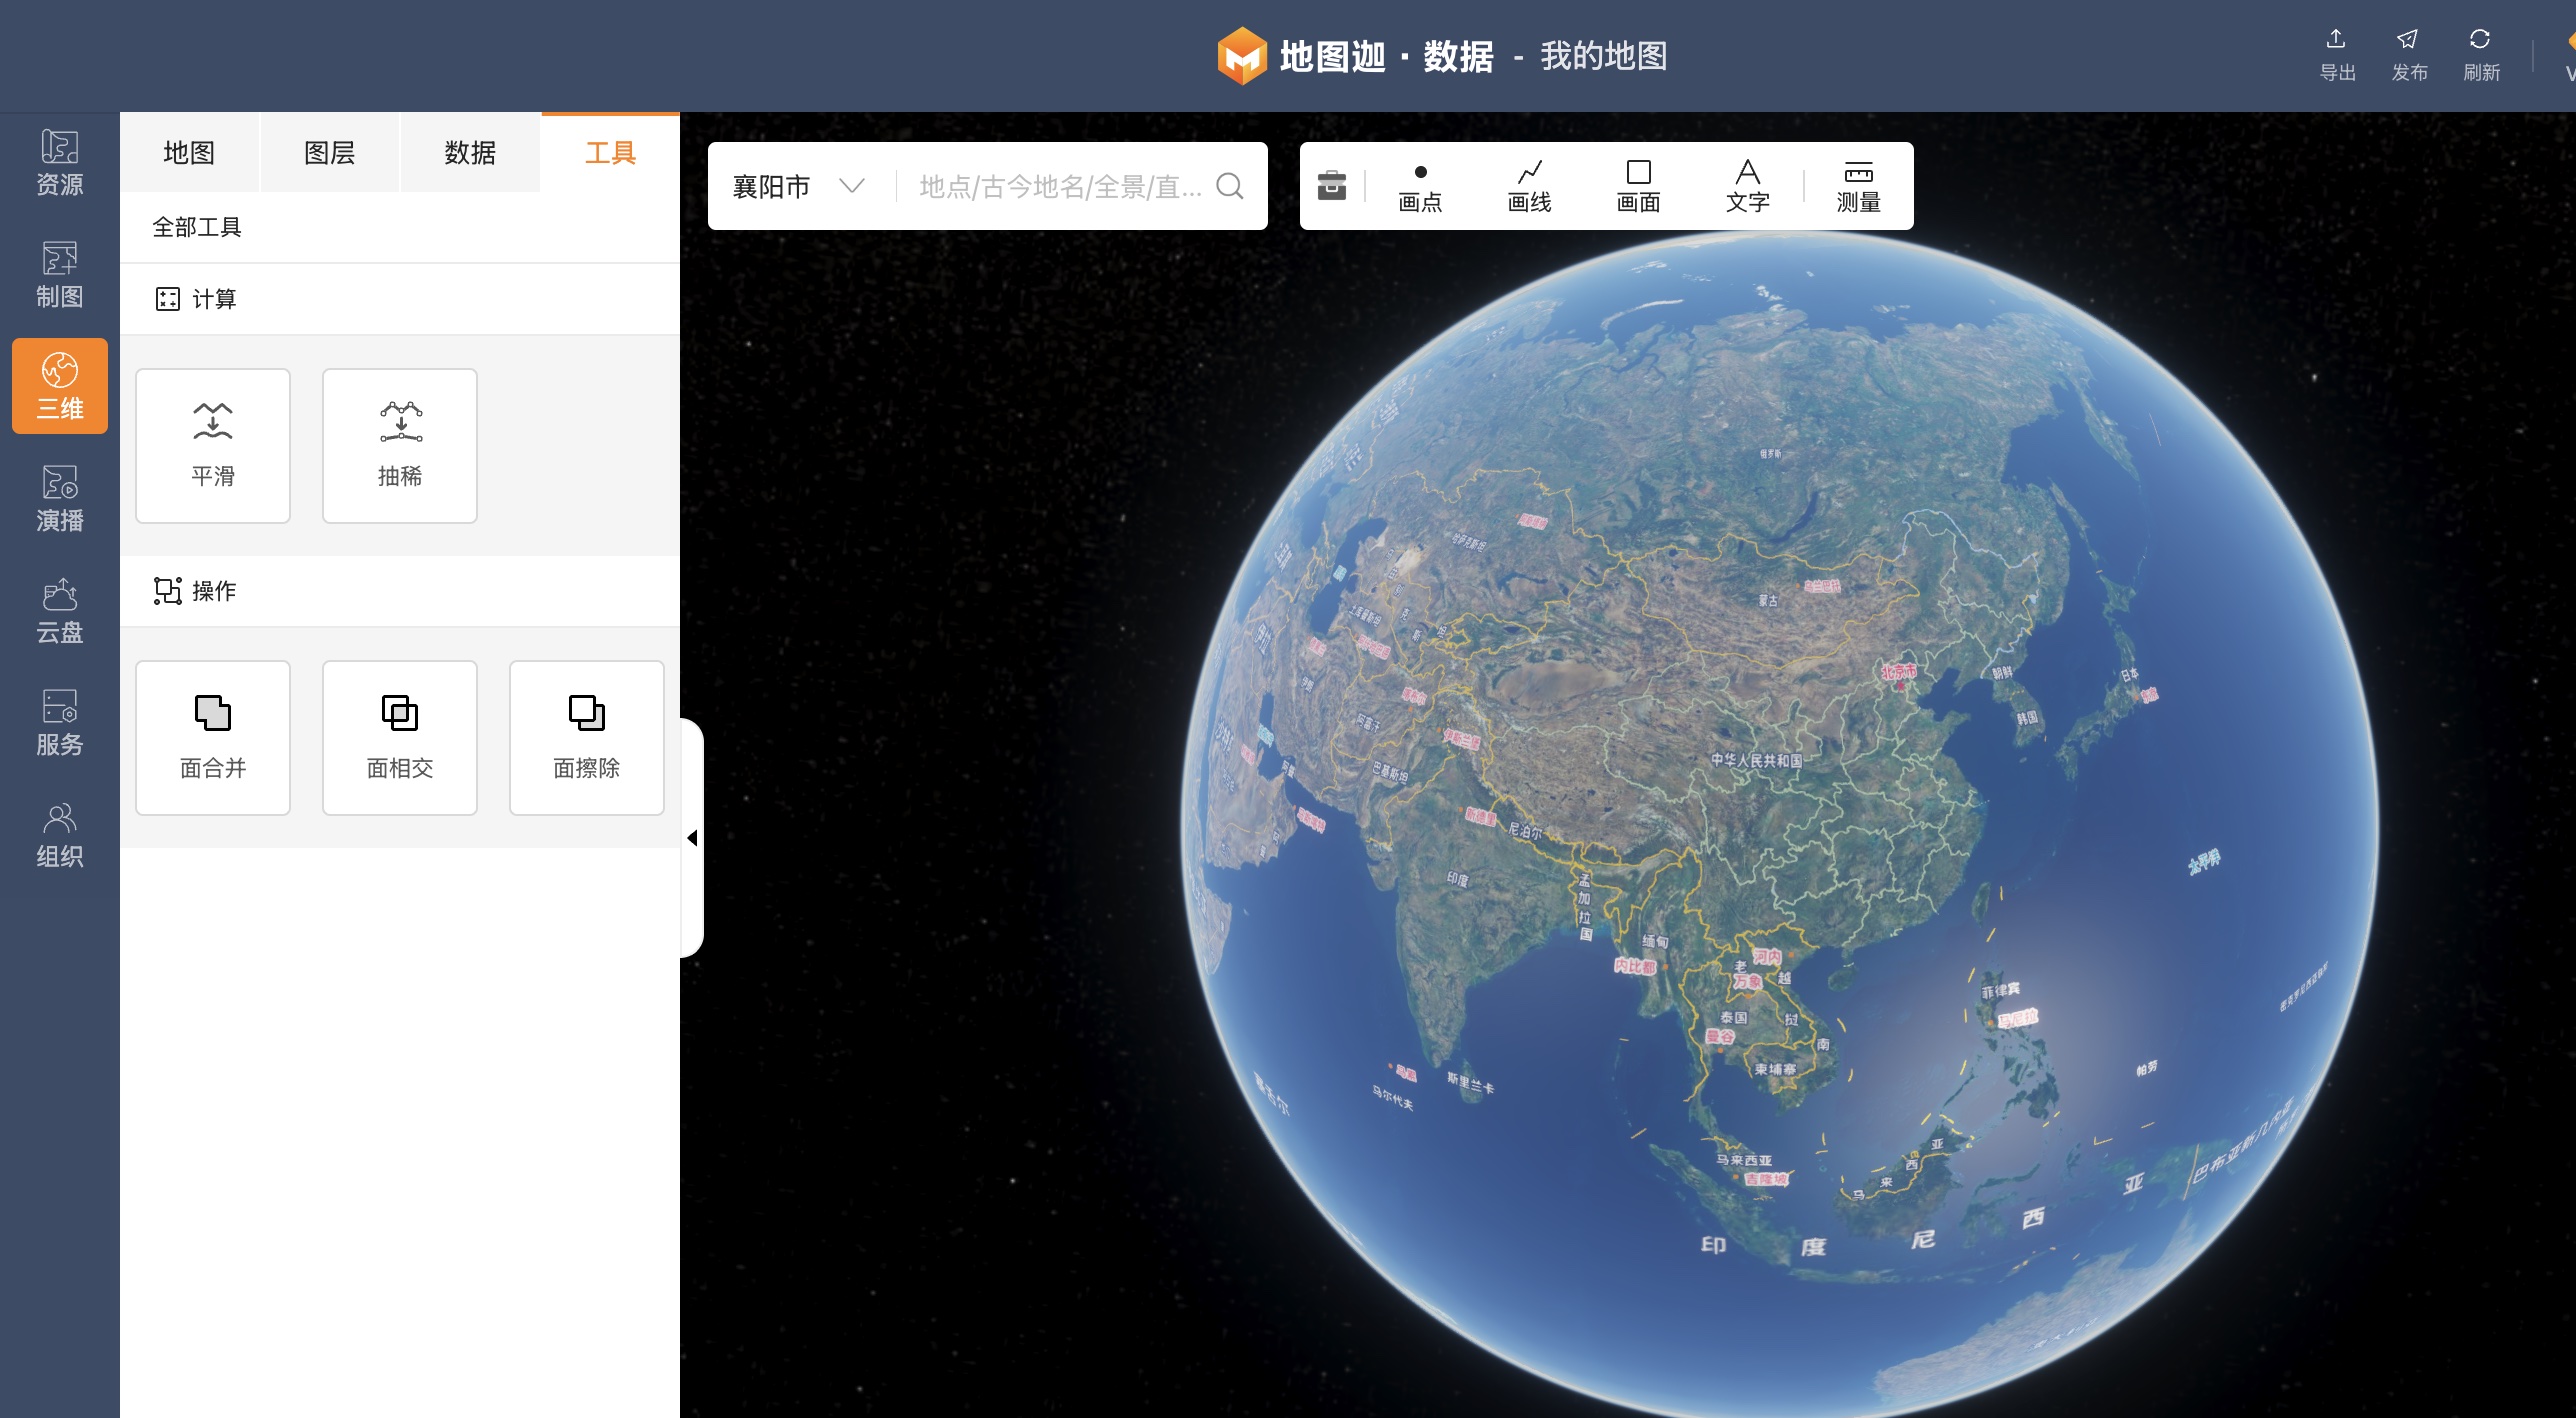
MapPlus offers four modules: Enterprise, Fieldwork, Data, and Broadcast. For dynamic mapping, we utilize the Data Module (free tier available).
Step-by-Step Workflow
1. Route Data Preparation
- Access Data Module → Broadcast
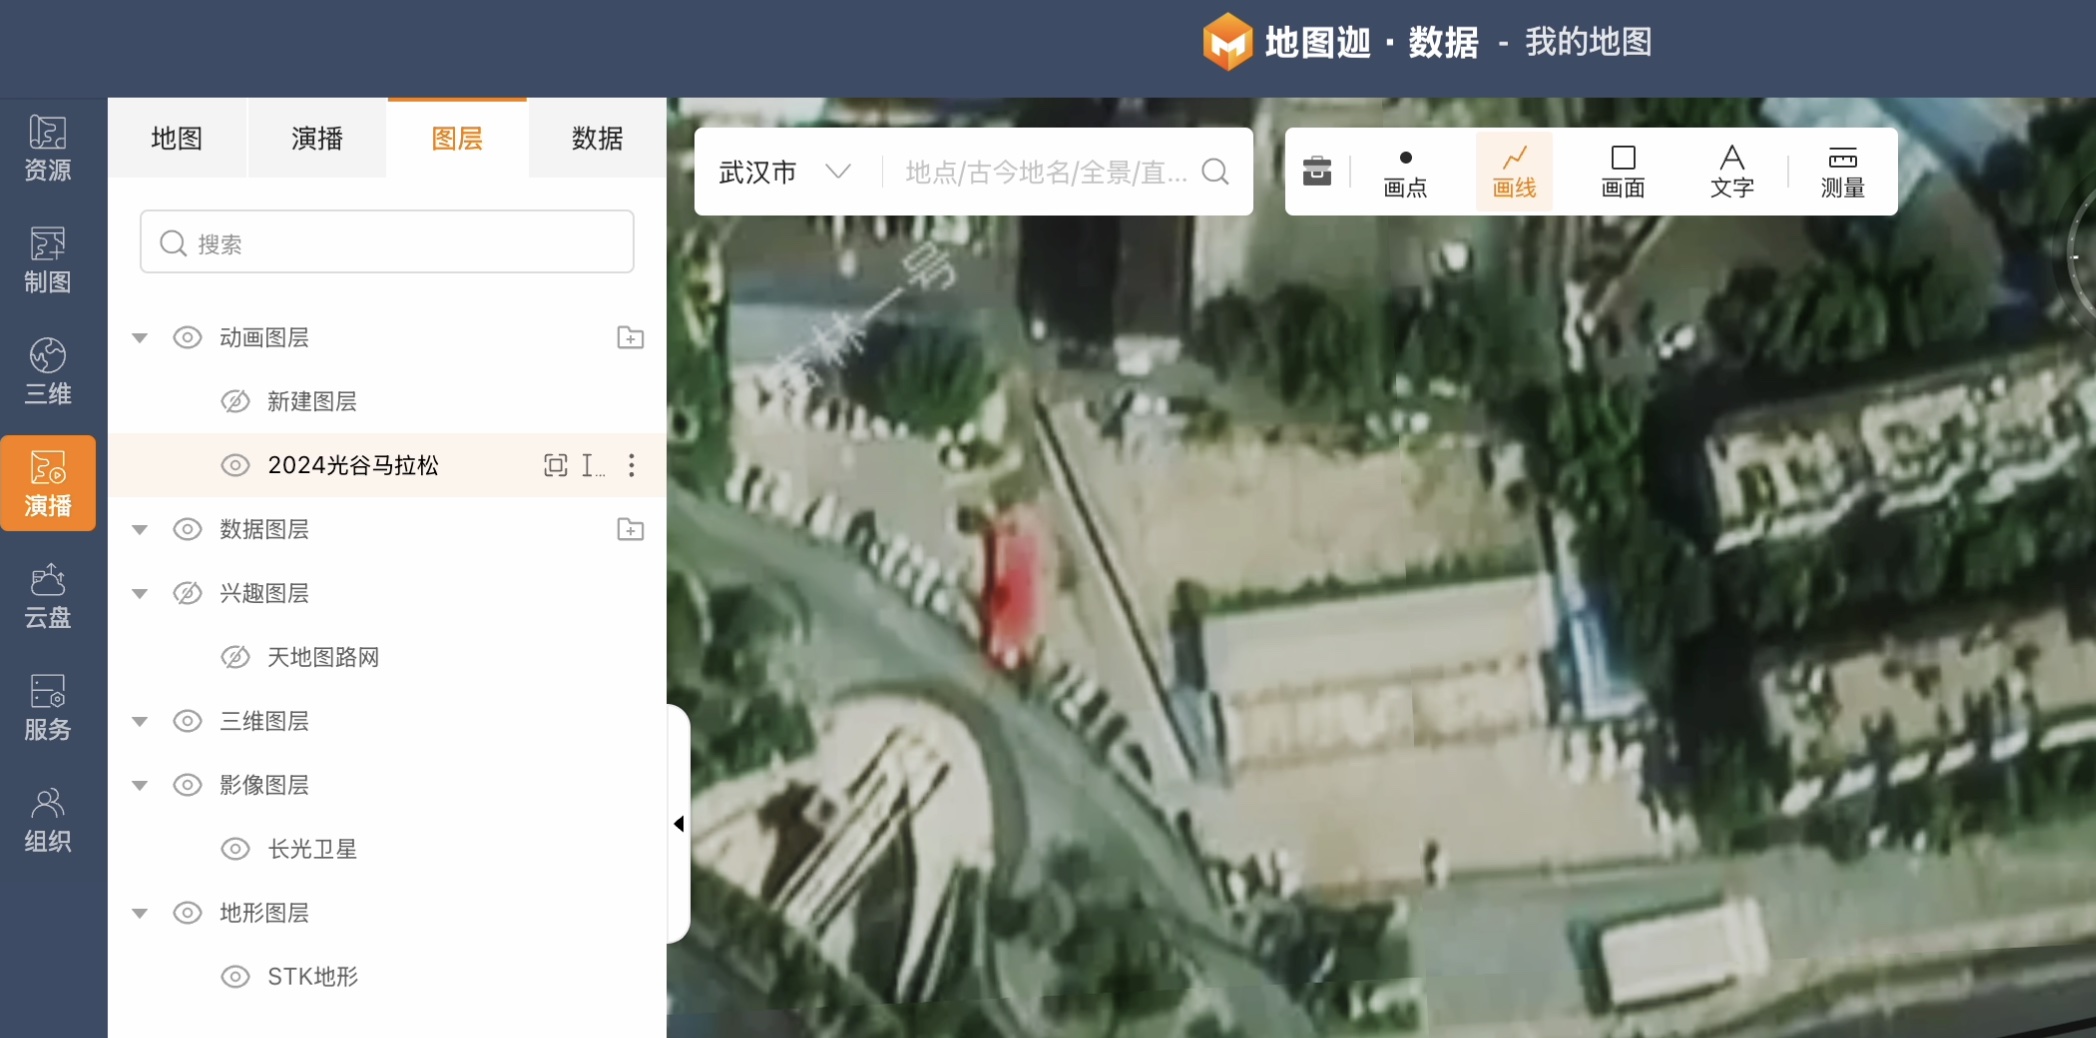
Import marathon route (KML format) or digitize manually:
- Create animation layer → Line drawing tool
- Trace route using high-resolution basemaps (Tianditu/Bing/Changguang Satellite recommended)

Result: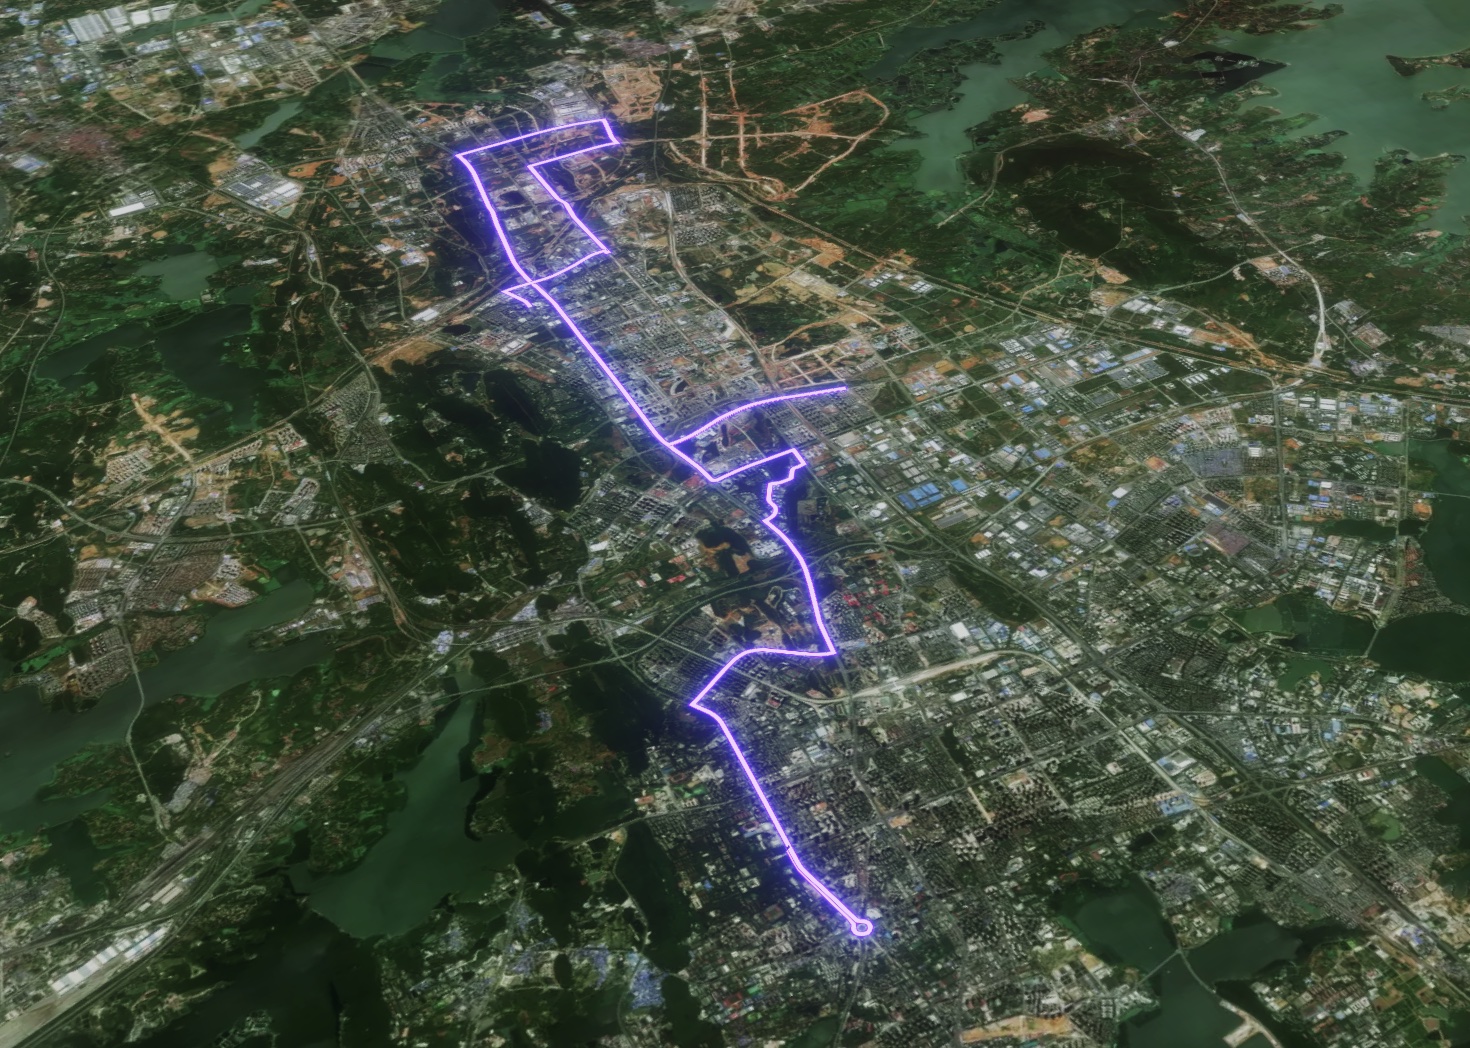
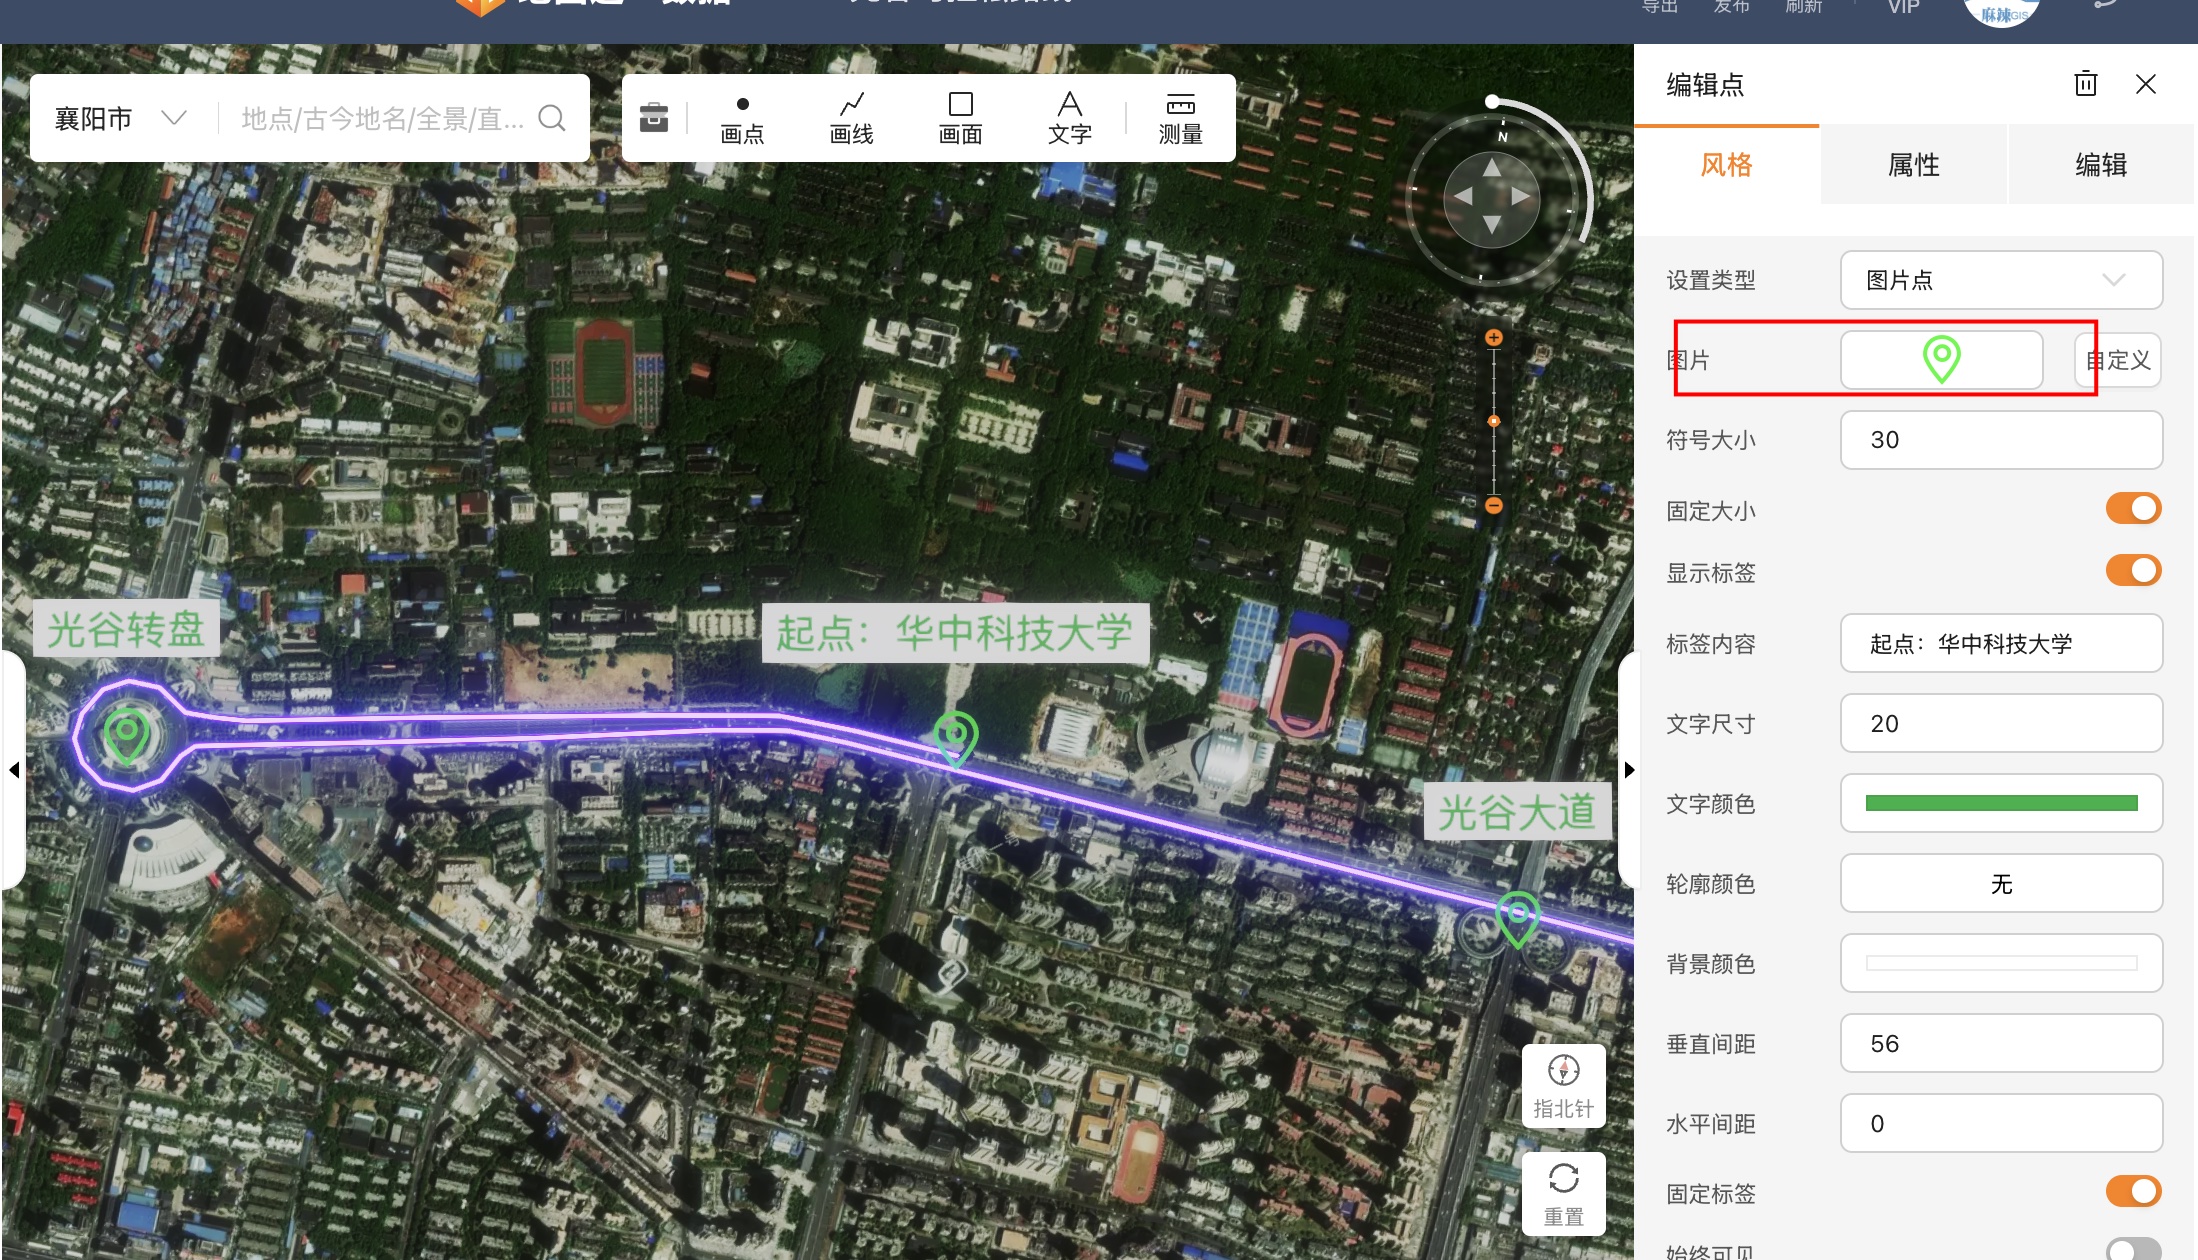
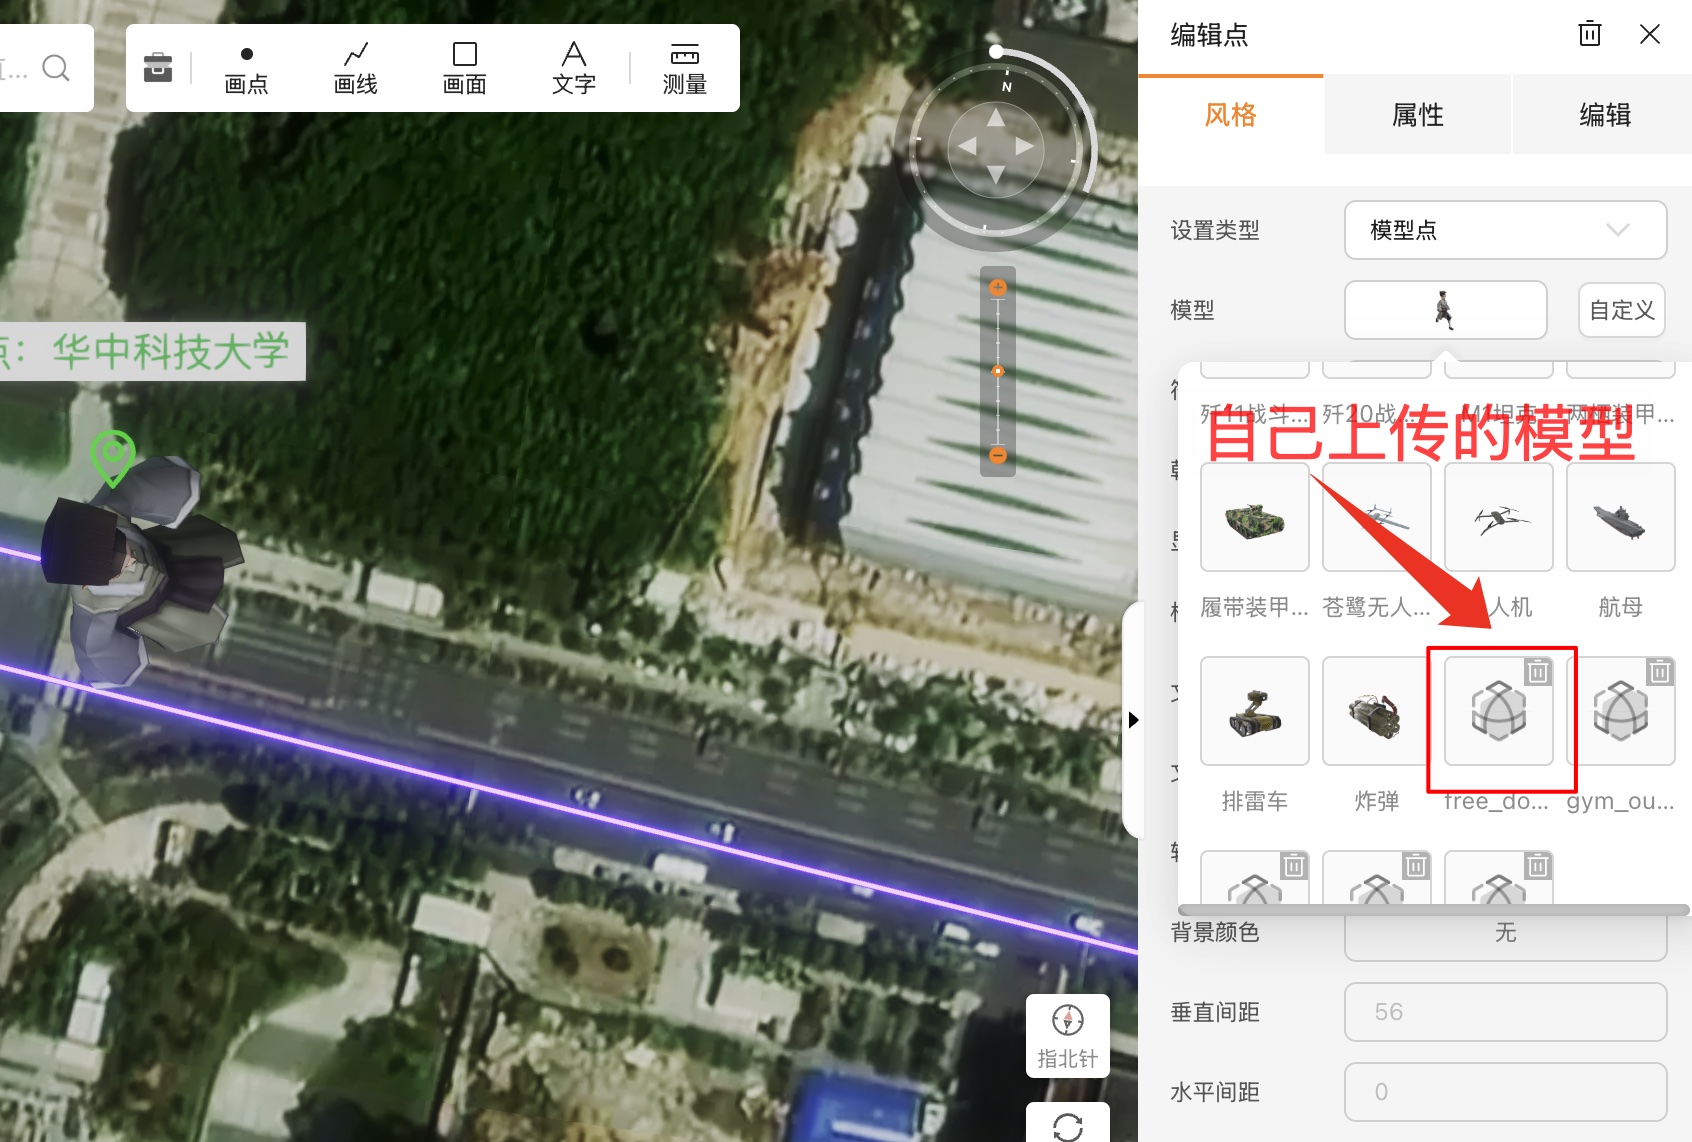
2. Key POI Annotation
- Create point layer for landmarks
- Customize symbology:
- Add animated runner (supports .glb models):
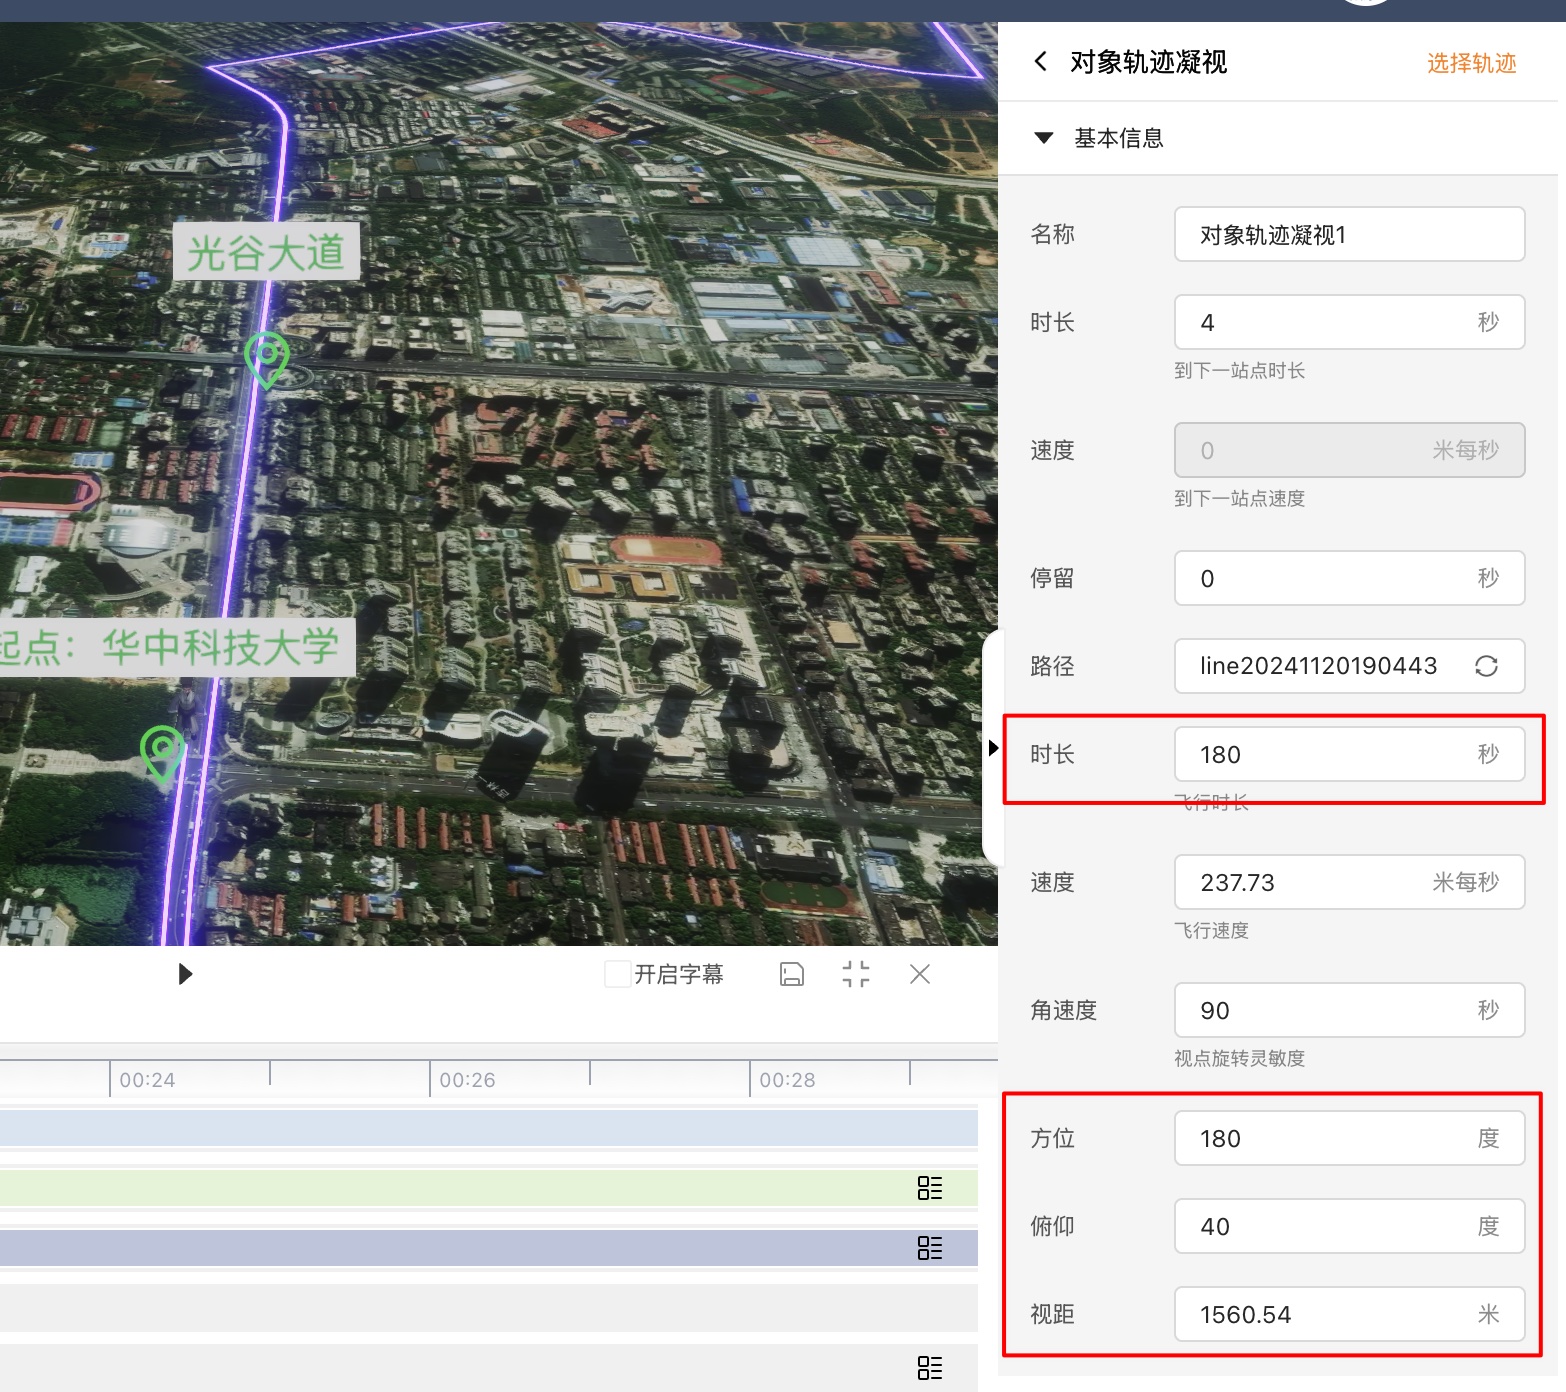
3. Animation Configuration
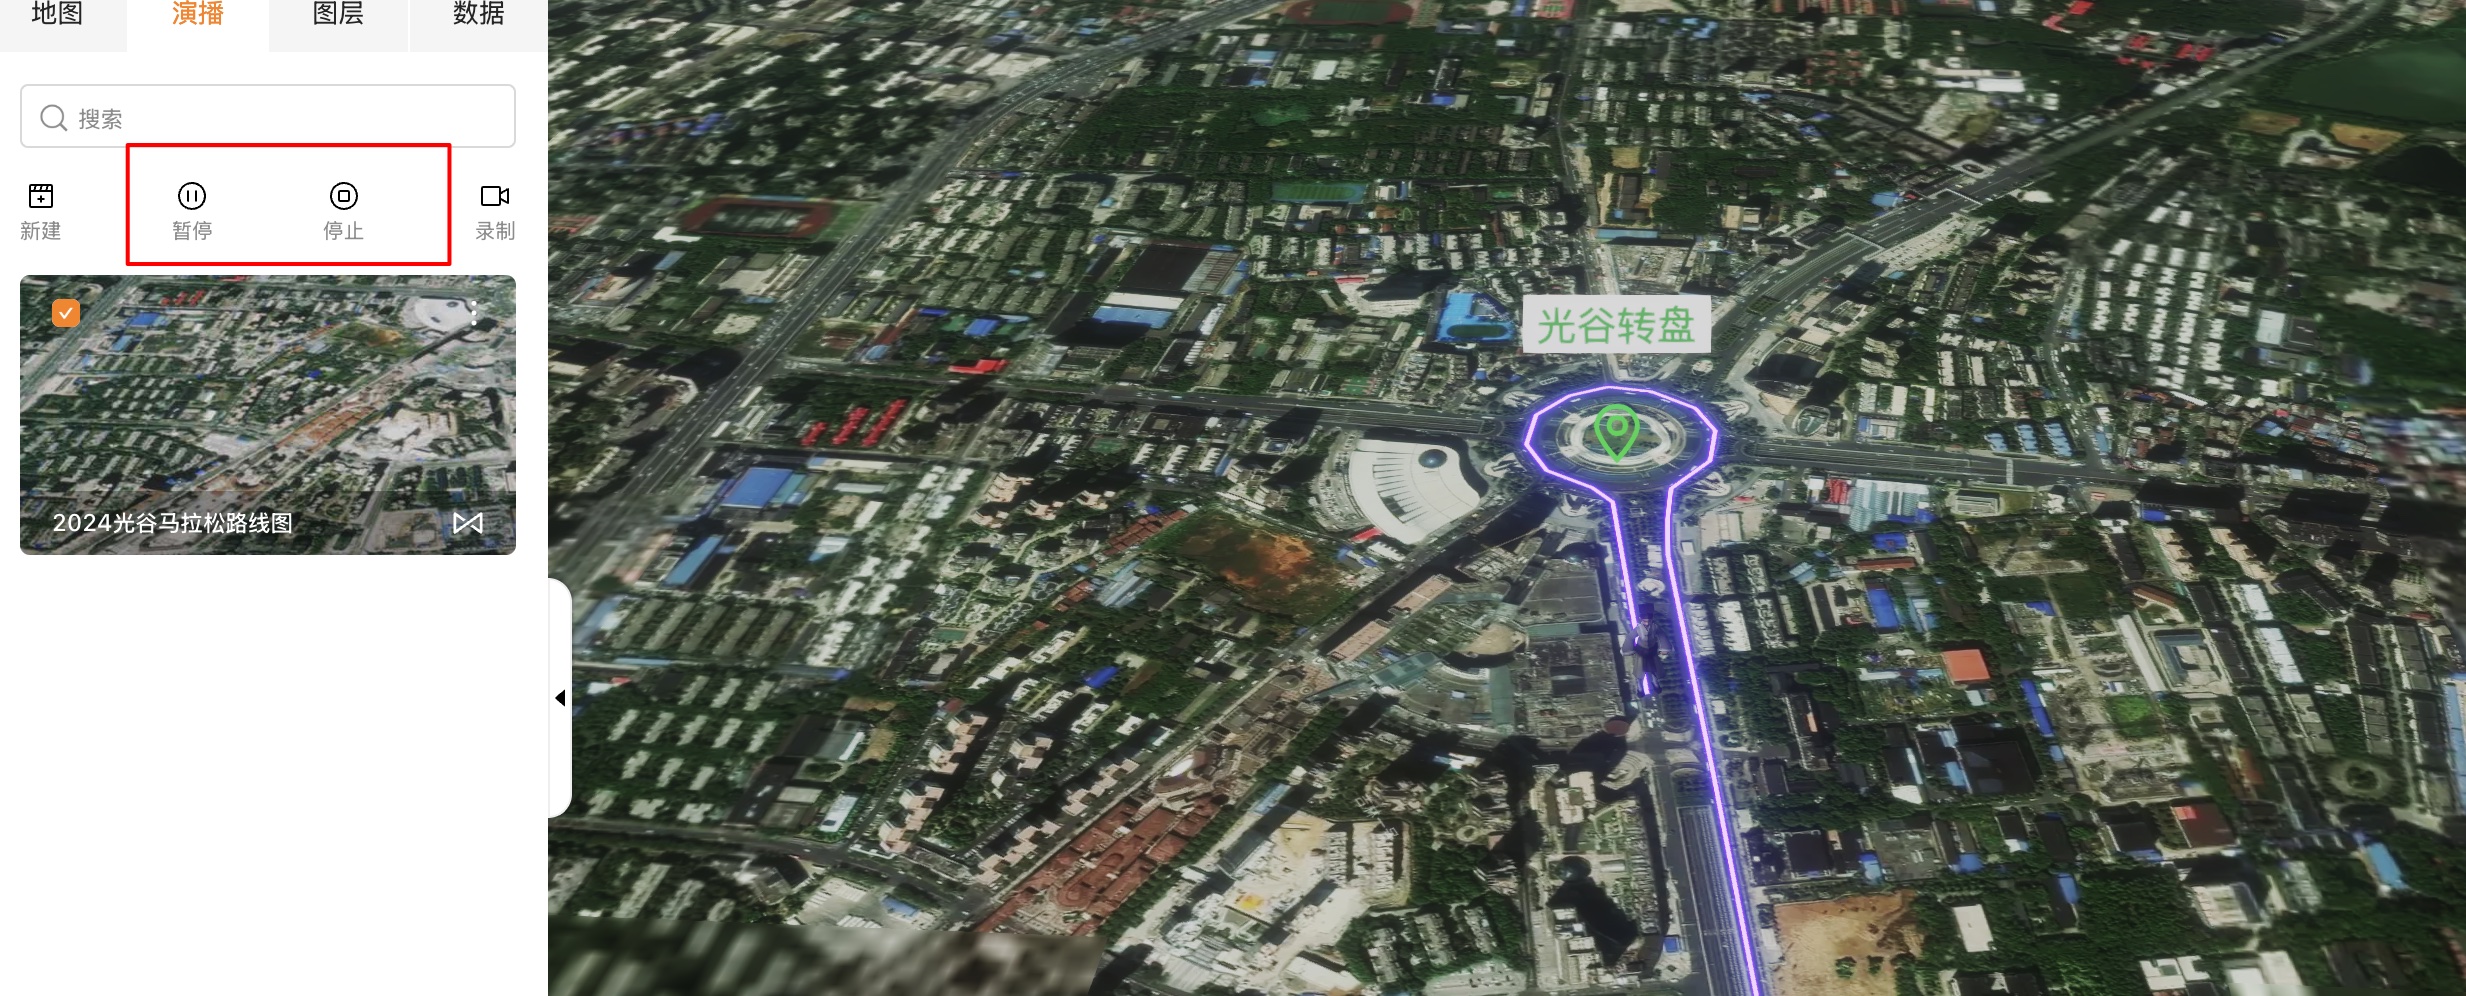
Switch to Broadcast tab:
Viewpoint Animation:
- Select "Object Trajectory Focus"
- Set duration ≈180s for smooth playback
Layer Animation:
- Apply "Line Growth" to route layer
- Apply "Line Growth" to route layer
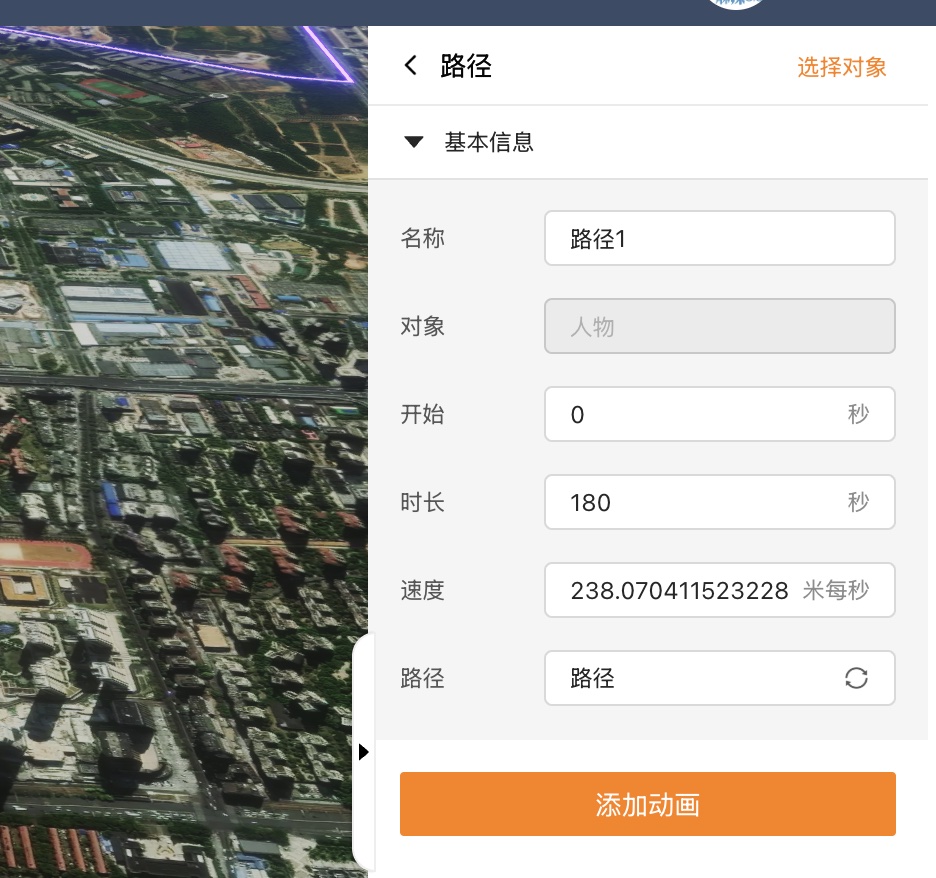
Object Animation:
- Animate runner along route
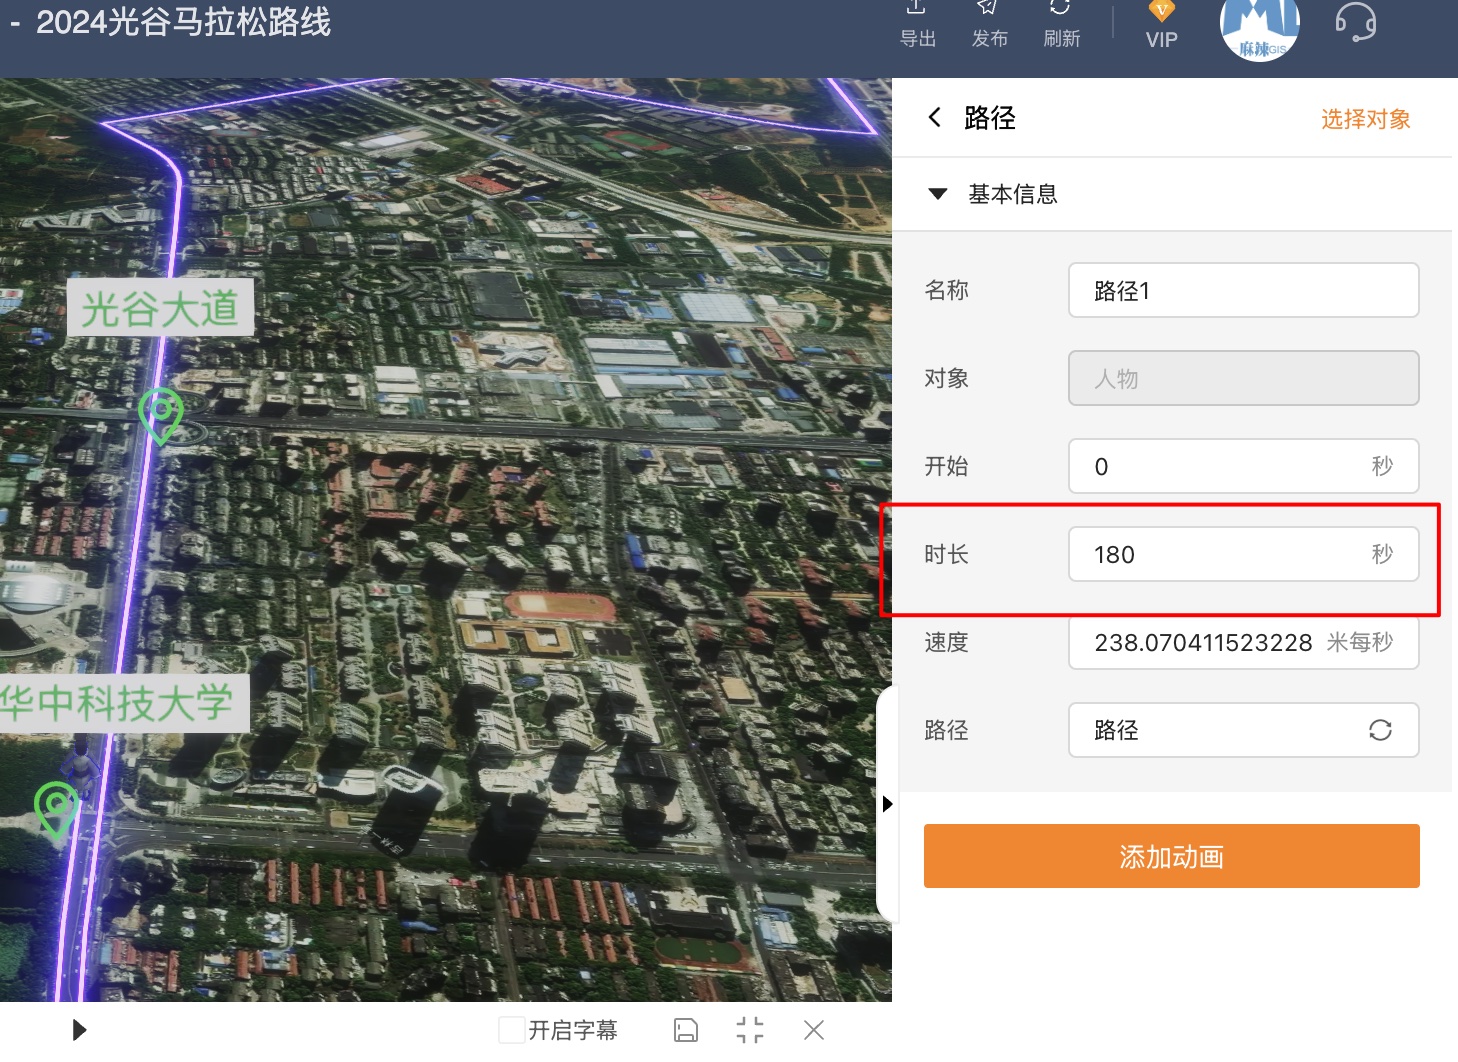
- Animate runner along route
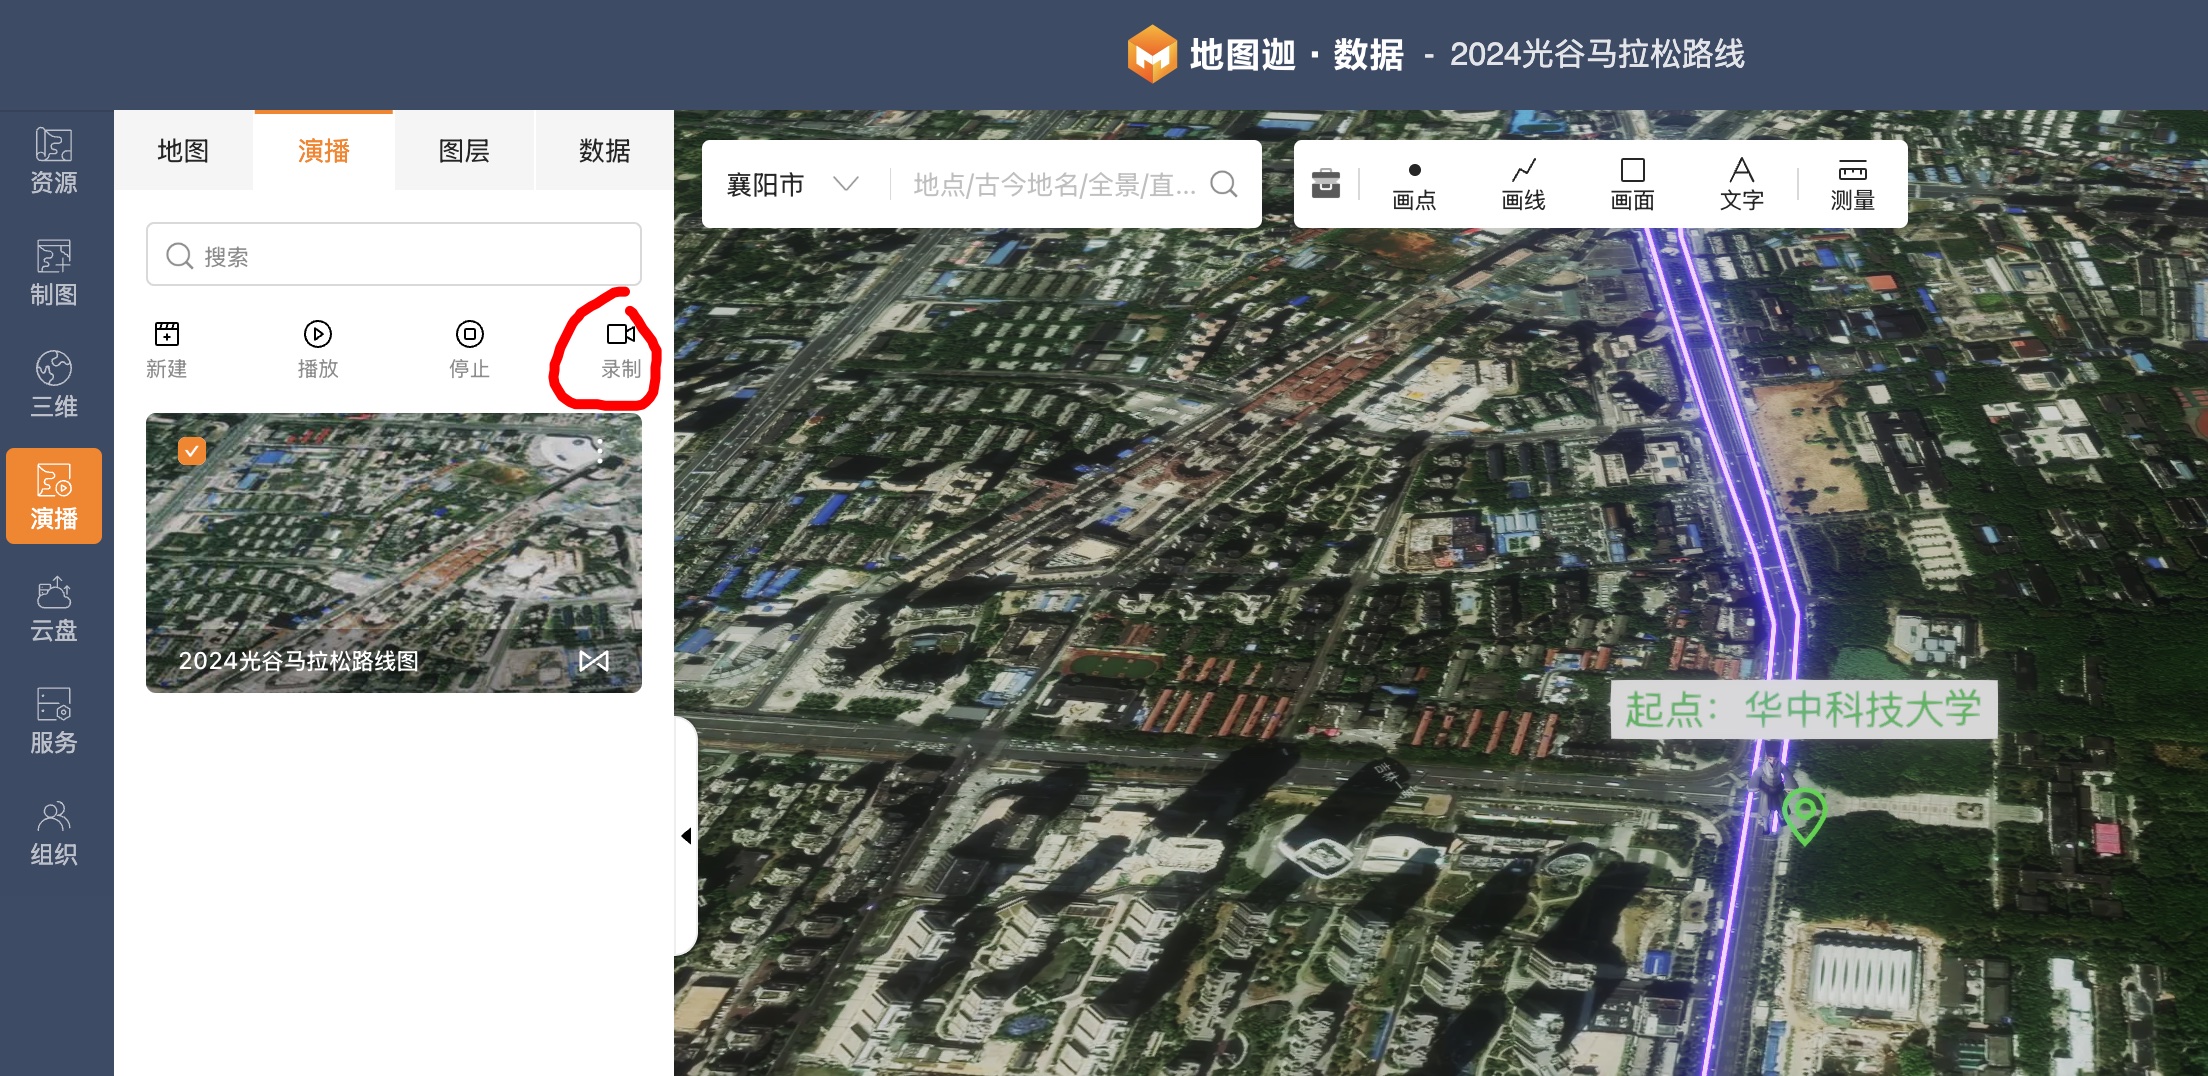
Publishing & Exporting
- Preview animations:
- Publish interactive map with background music:
Sample Output
- Export MP4 video for social media:
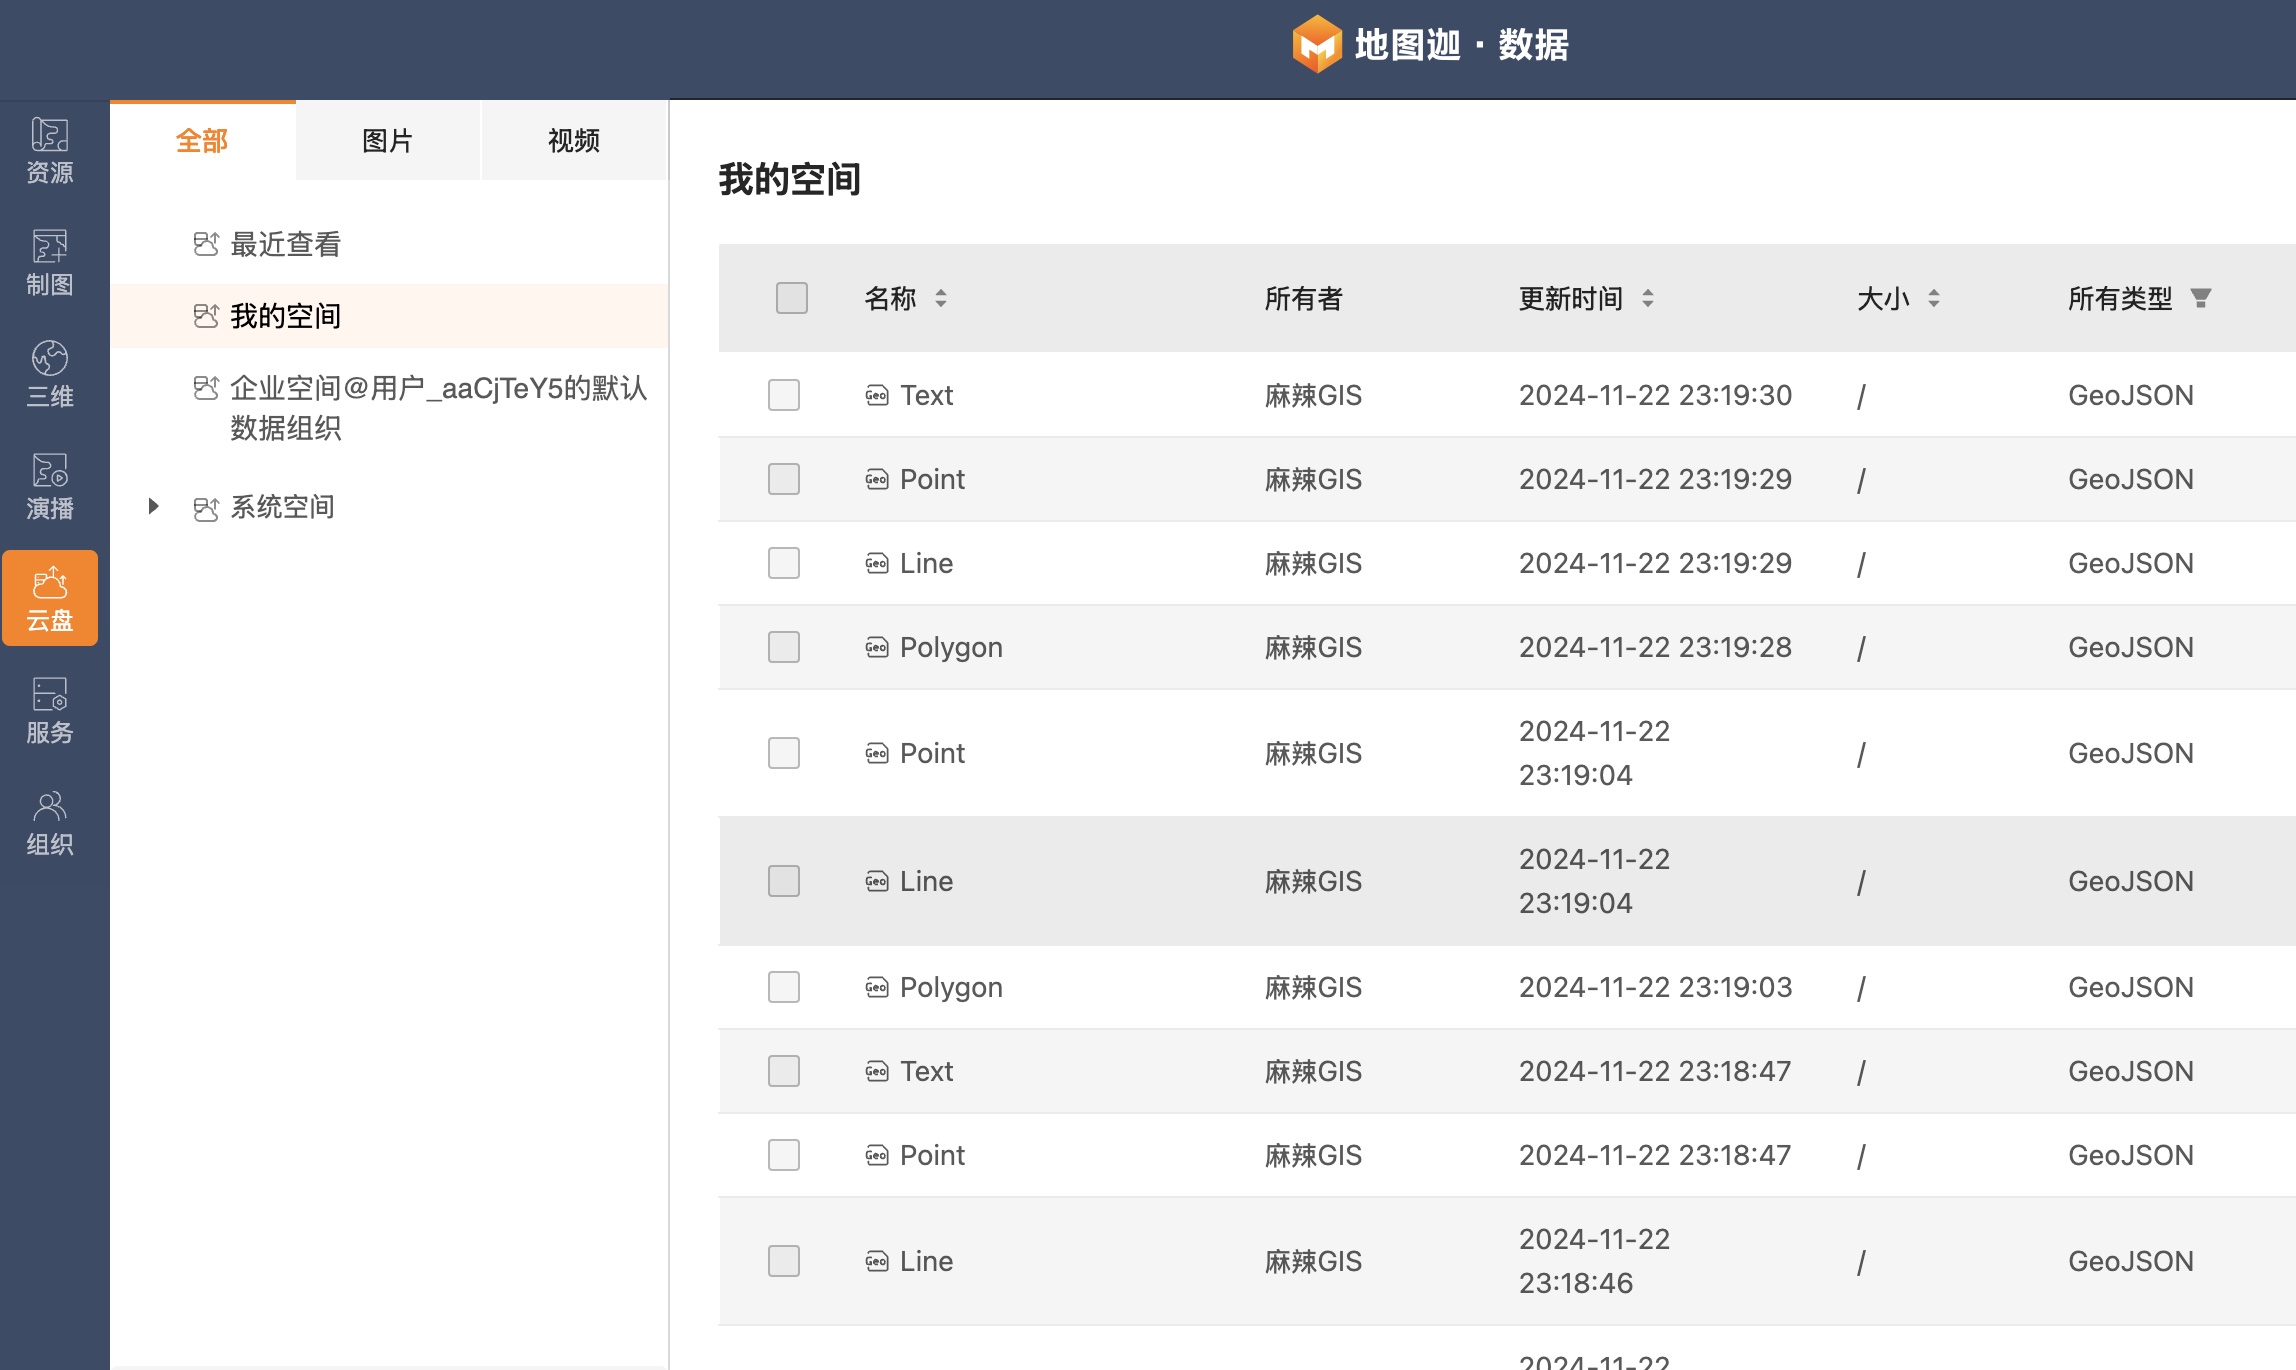
Data Management
Export to standard formats (KML/SHP) for GIS workflows: 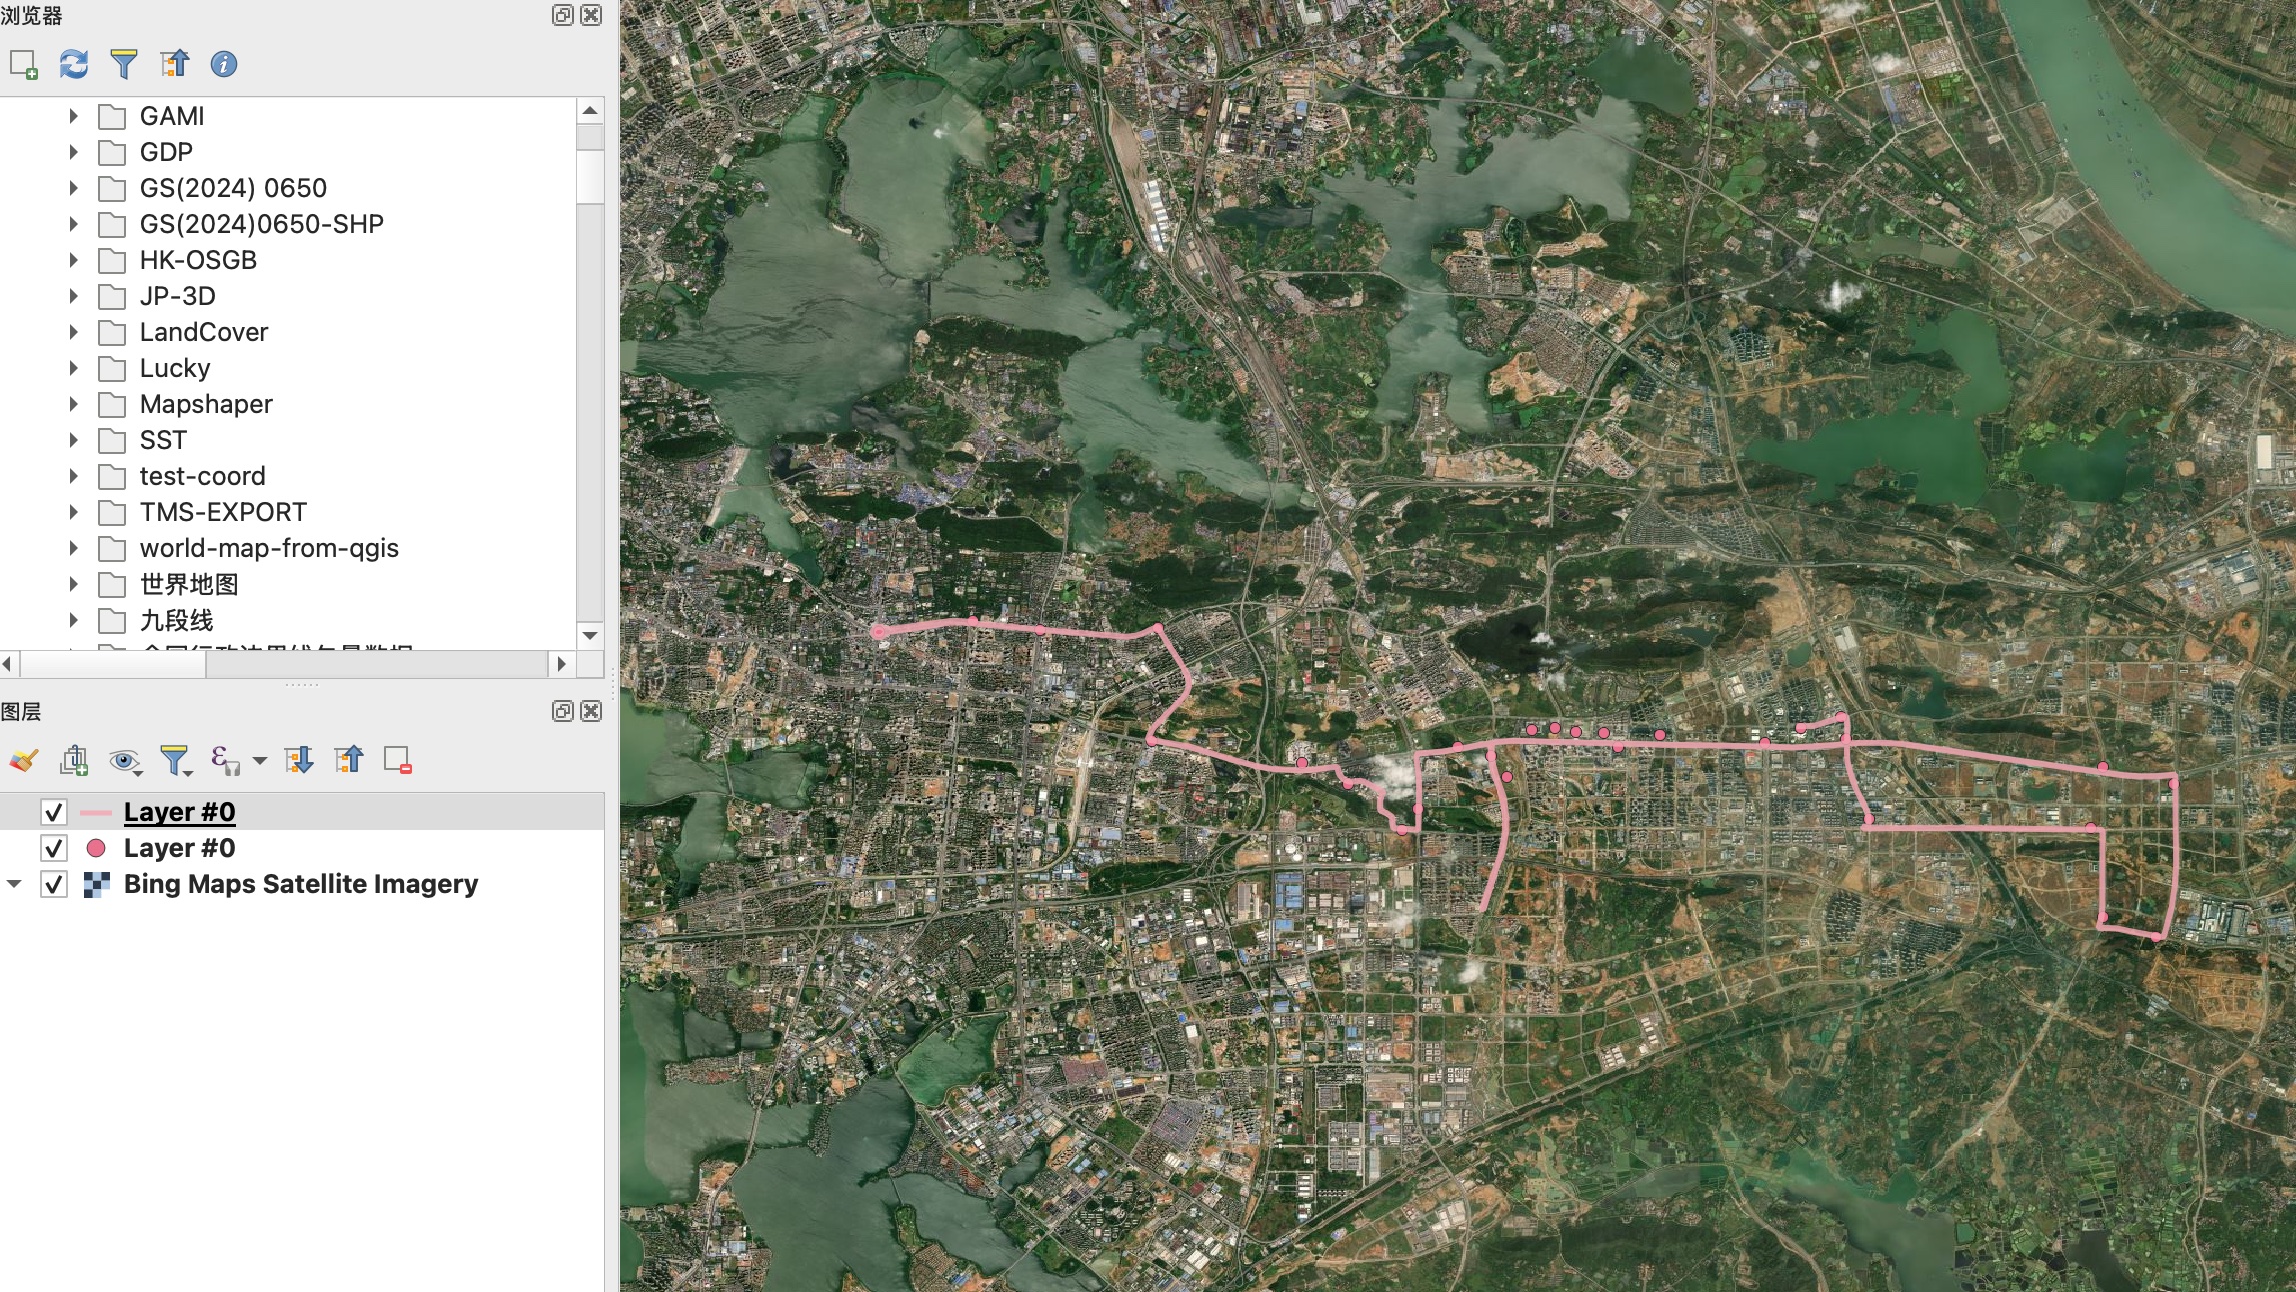
Pre-processed Data Download:
- Link: https://pan.baidu.com/s/1TrQblp4S2TPrbsm5Gqgt1Q
- Access code: ynkt
- Unzip password: malagis.com
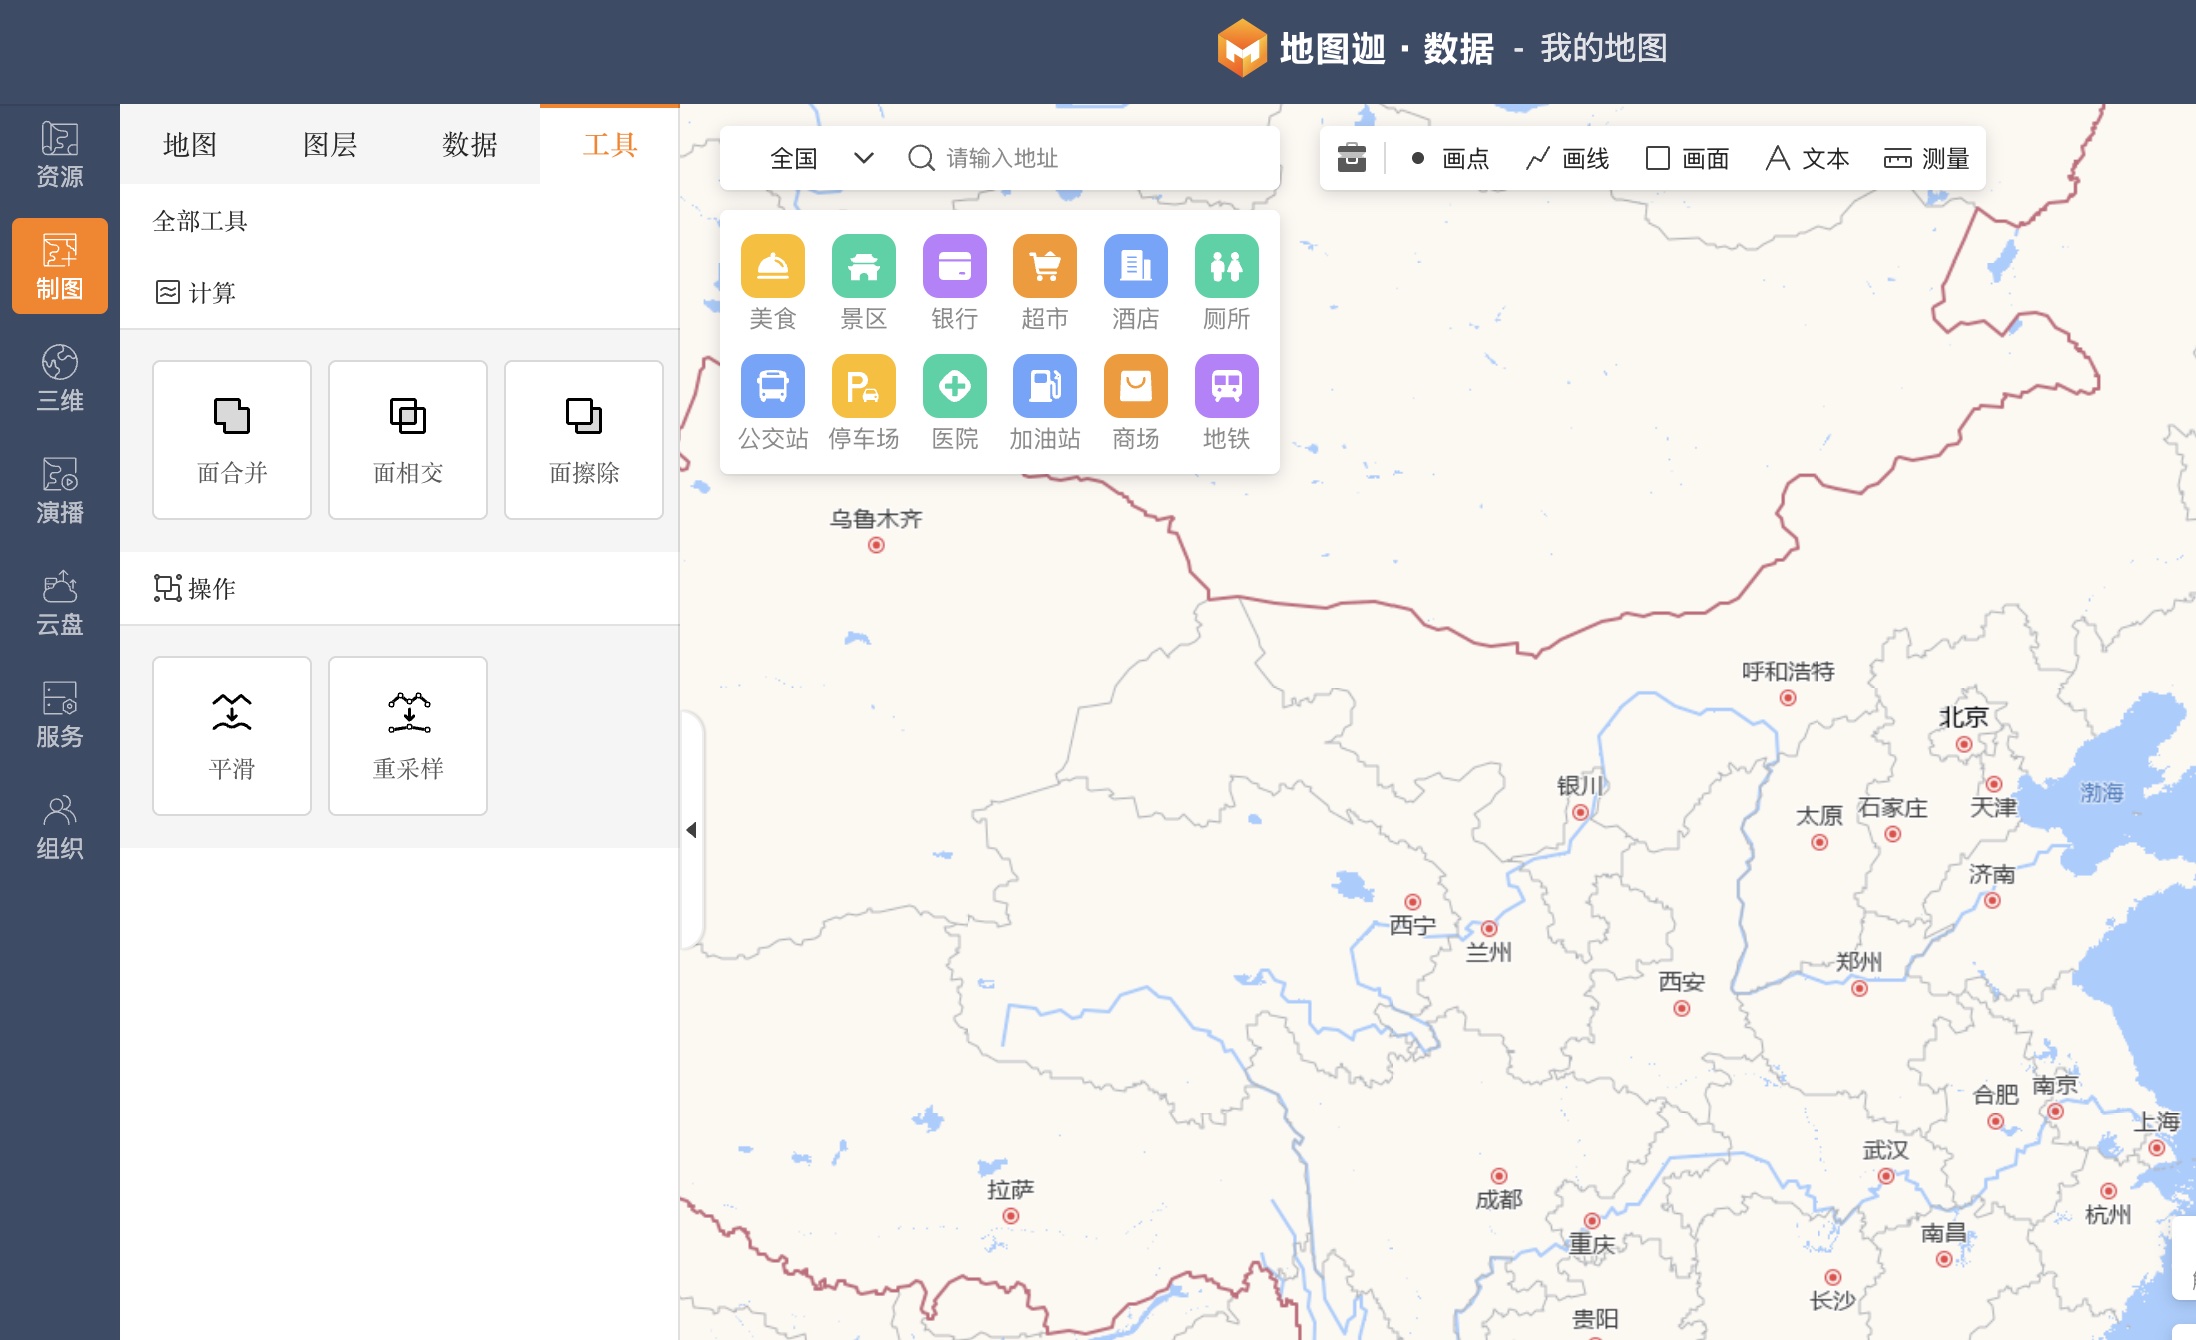
Additional Capabilities
- Automated cartography with national datasets:
- 2D/3D integration:
- Cloud-based data management:
MapPlus supports multi-source data (Excel/CSV/SHP/KML/GeoJSON) and requires no programming, making dynamic mapping accessible to all GIS professionals.