In recent years, terms featuring the word "cloud" have become incredibly popular, from public cloud and private cloud to cloud-native, cloud-edge integration, and even national land cloud, planning cloud, etc. It seems almost every industry is moving to the cloud. But have you ever wondered, when we talk about so-called "cloud" data, are those streams of 1s and 0s literally traveling through the sky from a physical perspective?
Actually, no. In fact, over 90% of global international data traffic is transmitted through cables lying in the dark depths of the ocean. From the short video you just watched, to cross-border financial transactions, and even the answers you get from Gemini or ChatGPT, are all exchanged via lengthy submarine cables. But where exactly are they laid? Which countries are international communication hubs? How do different cables differ in bandwidth and operators? Today, let me recommend a must-bookmark professional tool website for all GISers — Submarine Cable Map.

About Submarine Cable Map
- Official Website: https://www.submarinecablemap.com/
- Producer: TeleGeography (a global authority on telecommunications market research)
- Core Function: No registration required. View the global submarine cable topology, landing points, and attribute data directly on the map.
Click on any cable line, and you'll find information such as:
- Basic Info: Cable name, construction year, ready-for-service date.
- Core Parameters: Design bandwidth, transmission technology standard.
- Operators: Consortium of carriers involved in the construction (mostly multinational telecom alliances).
- Route Info: Start point, end point, and key passing nodes (countries/regions, submarine hubs).

For example, the "New Cross Pacific (NCP) Cable System" shown above connects China (including Taiwan Province), Japan, South Korea, the United States, etc. It spans 13,618 km, entered service in 2018, and has operators including China Unicom, China Mobile, China Telecom, and Microsoft.
PS: Looking at this map might help you understand why accessing international networks can be faster from places like Qingdao or Shanghai (wink).
Some Interesting "Trivia"
- Which is the world's longest cable? Look for the 2Africa cable. It stretches 45,000 km, almost encircling the entire African continent and connecting 33 countries.

- Do sharks bite cables? There were indeed legends of shark bites causing outages in the early days. However, modern cables are protected by extremely strong Kevlar layers and steel wires, making them "uncrushable" for sharks now.
- Finally, look at the Red Sea area—the density of lines there is astonishing. This explains why geopolitical conflicts in this region can affect global network latency.

Viewing the Actual Physical Path of Your Access
Some might ask, how can I see where my requests actually go when I visit a website? Remember the article we previously wrote, "GIS Tool: Visualizing Your Network Requests on a Map"? Yes, simply download a tool called BestTrace.
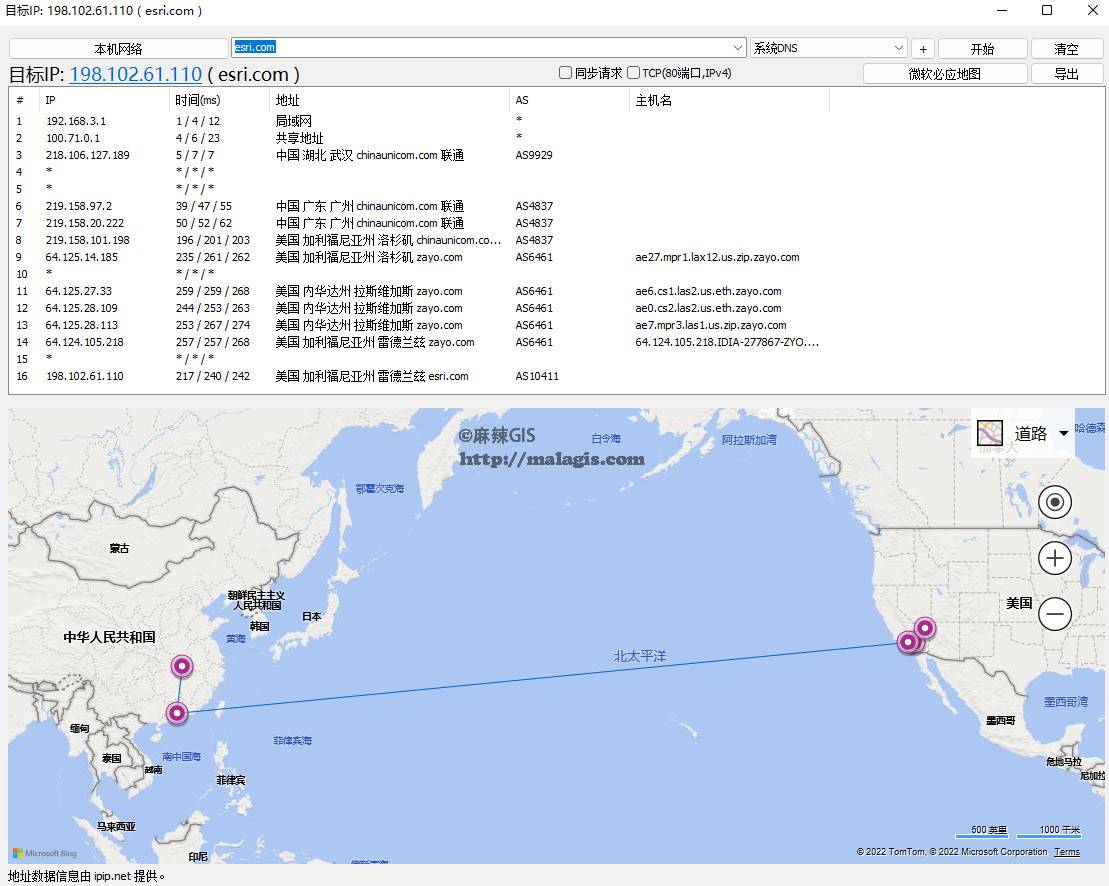
Download Link: https://www.ipip.net/product/client.html
Interested friends can go and try it out.
Conclusion
Lastly, and most importantly, it must be emphasized that the map used by this website is not a standard map of China. Please exercise caution when using it. The author has deliberately avoided using it in this article.
Submarine cables are the "lifelines" of the global digital economy. This website uses GIS technology to make these "lifelines" visible, searchable, and understandable. This, I believe, is precisely what we GISers should be doing.