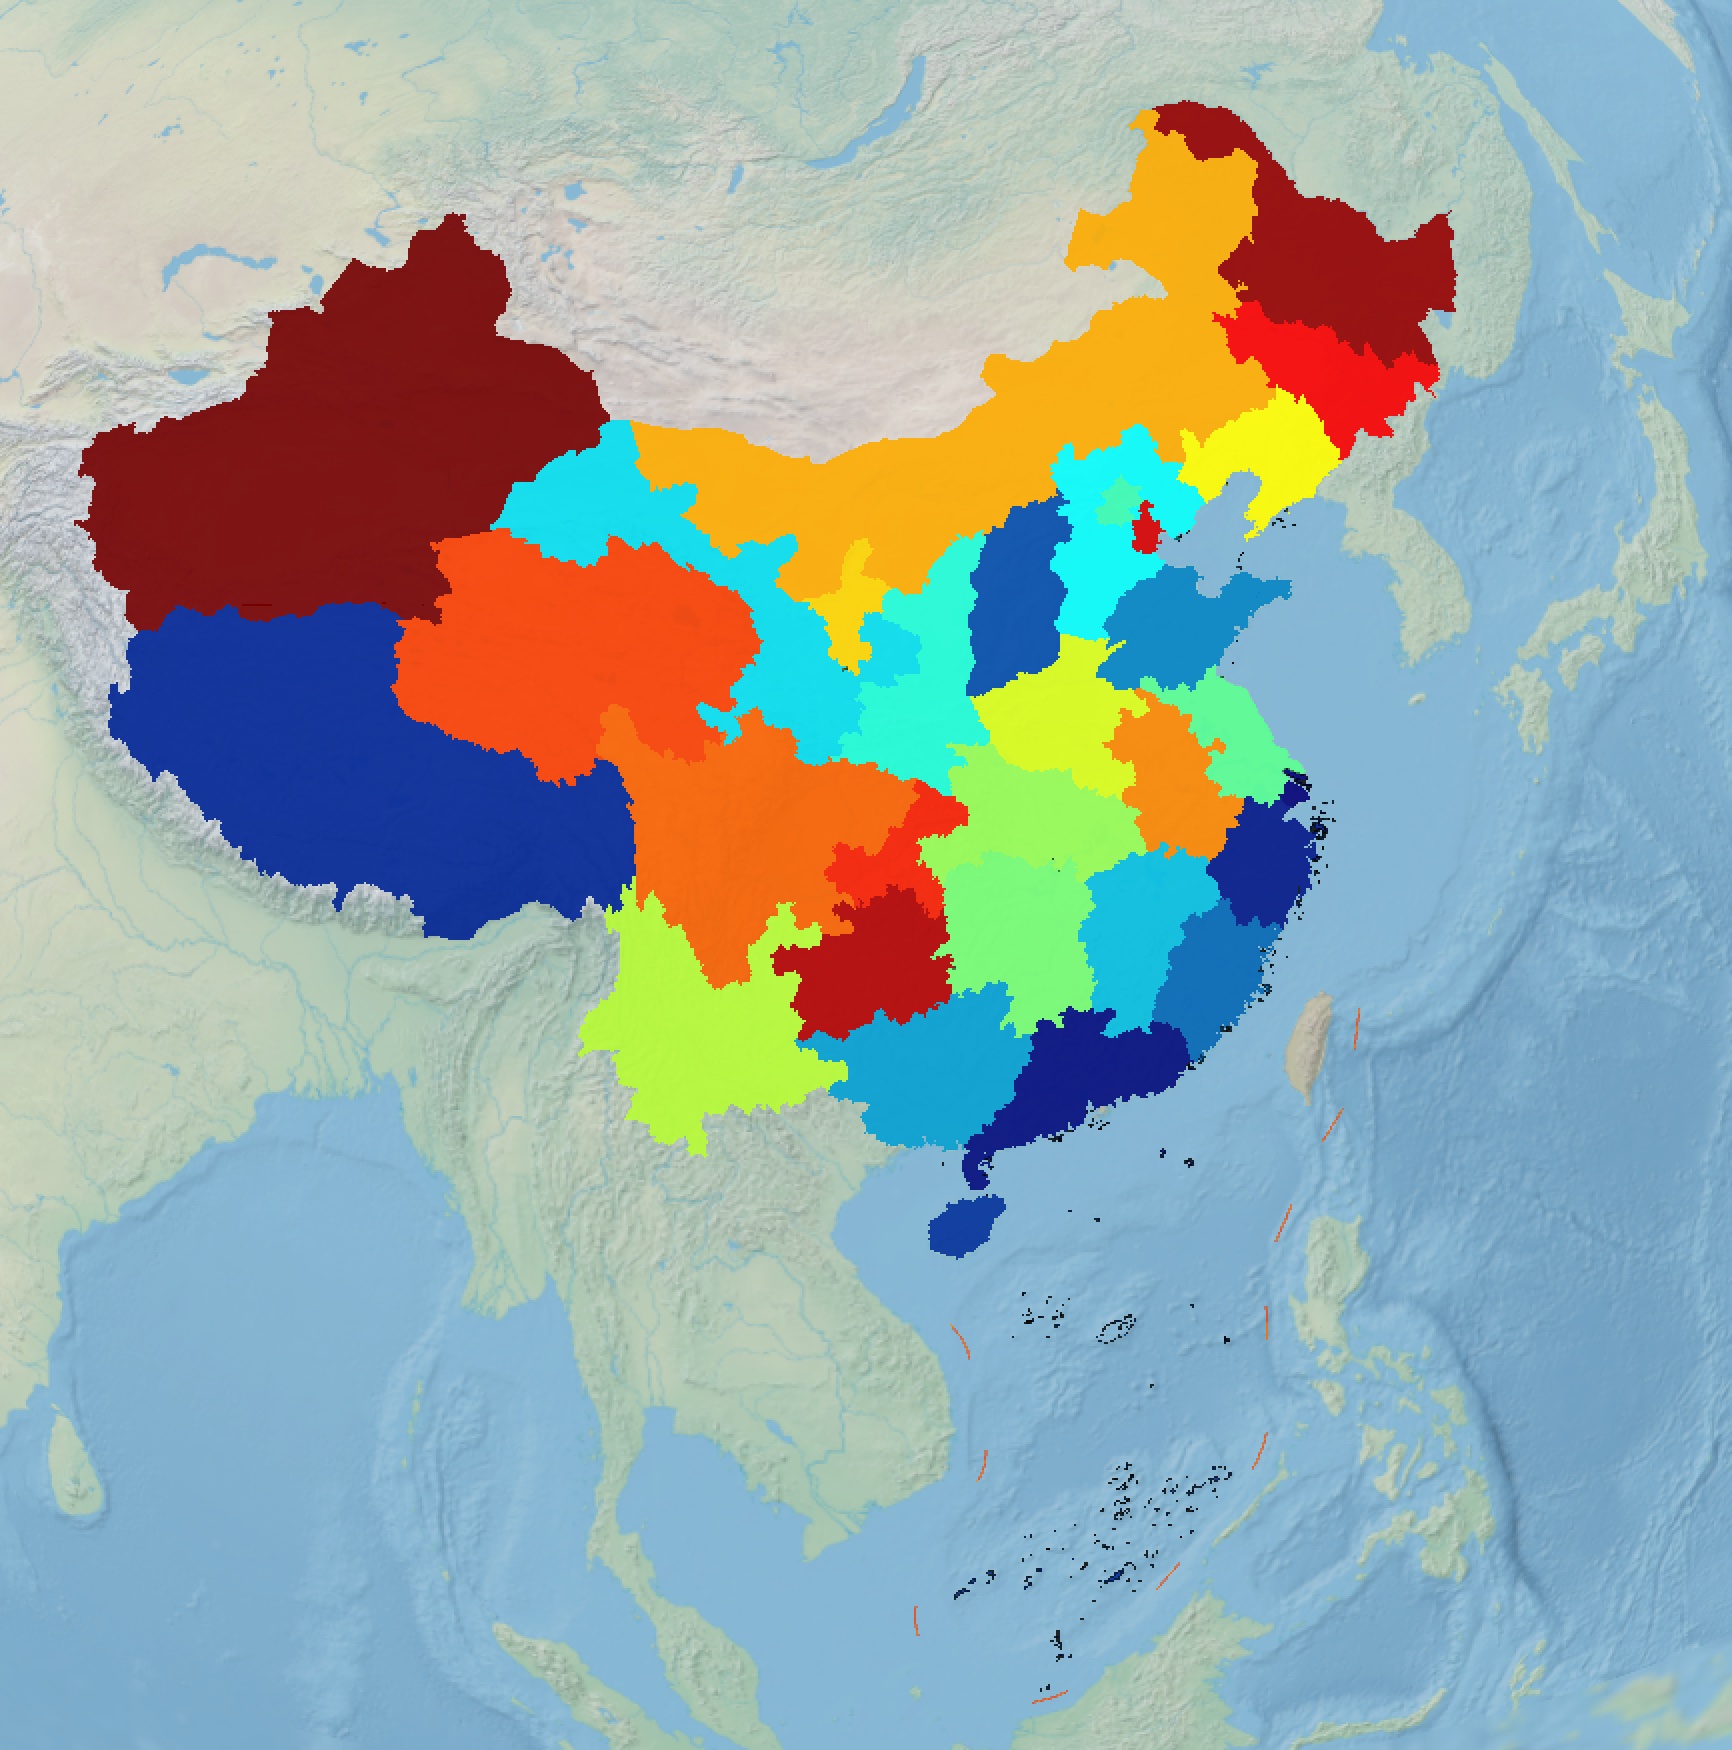
When creating thematic maps in ArcGIS or QGIS, thematic coloring (choropleth mapping) is a common technique where different regions are colored according to their data values, revealing spatial patterns. Recently, our management requested integrating this functionality into our business system. While we could publish pre-rendered maps from ArcGIS/QGIS through servers like GeoServer, this lightweight feature doesn't warrant heavy infrastructure. Instead, I explored coloring GeoJSON features directly and discovered colormap - an elegant solution.
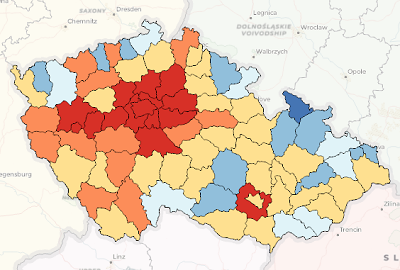
Figure: Thematic coloring effect in ArcGIS
Introducing Colormap
Official Page: https://www.npmjs.com/package/colormap
Source Code: https://github.com/bpostlethwaite/colormap
The library includes color ramps based on matplotlib, cmocean, cosine gradients, and other scientific visualization sources: 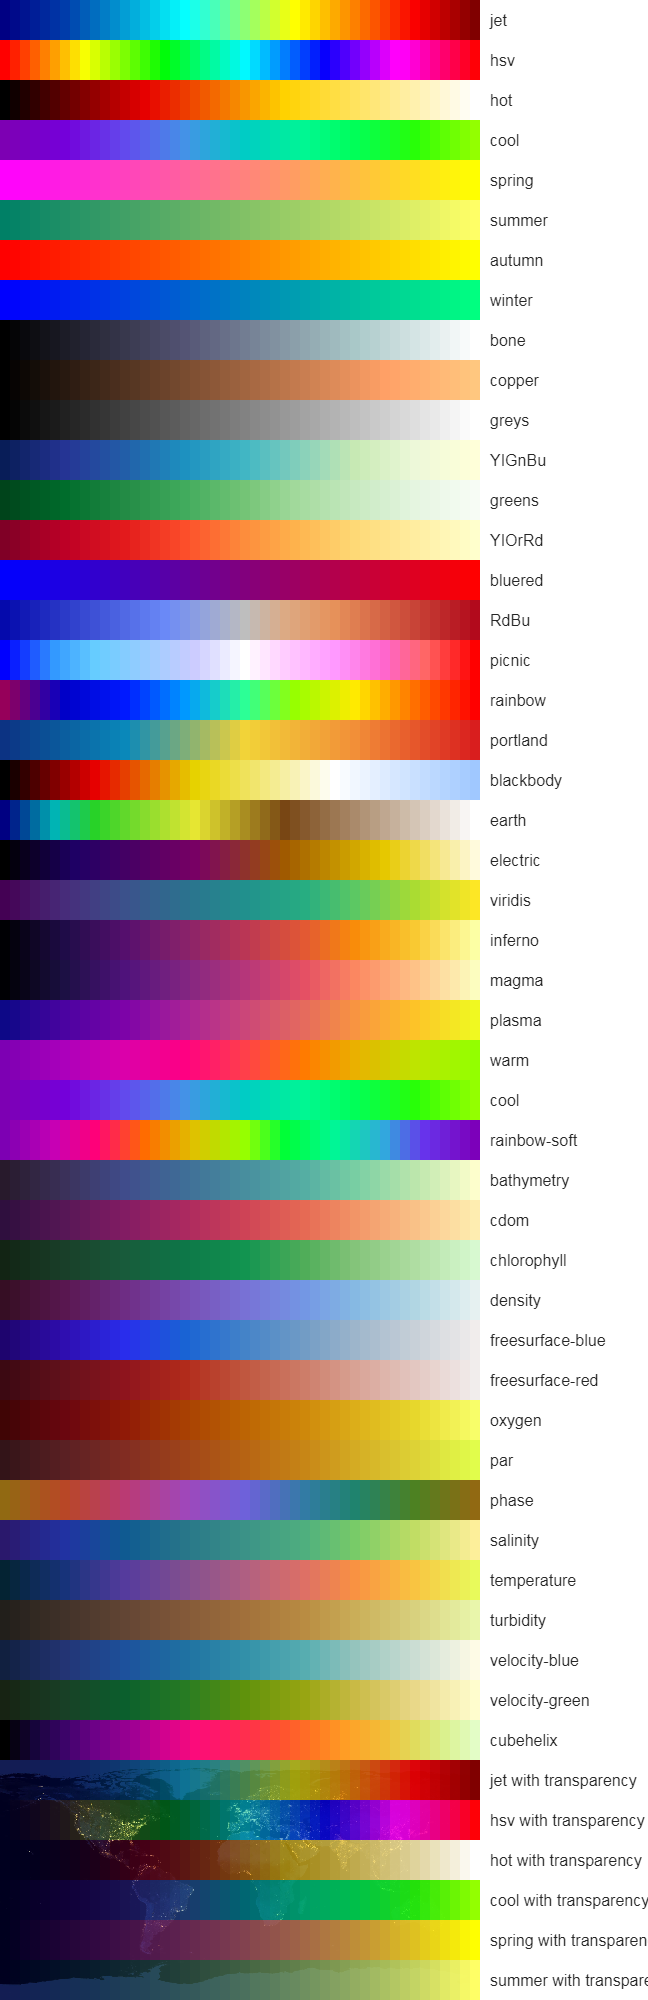
Implementation
NPM Installation
bash
npm install colormap --save
Code Implementation
javascript
let colormap = require('colormap');
// Generate 10-step color gradient using 'jet' palette
let colors = colormap({
colormap: 'jet',
nshades: 10,       // Number of color steps
format: 'hex',     // Output format (hex/rgb/rgba)
alpha: 1           // Opacity (0-1)
});
Visualization Demo
Integrated with Cesium using 2023 provincial divorce rates in China: