MalaGIS

Sharing GIS Technologies, Resources and News.

How to Render Albers Projection in Web Maps Using OpenLayers and Leaflet

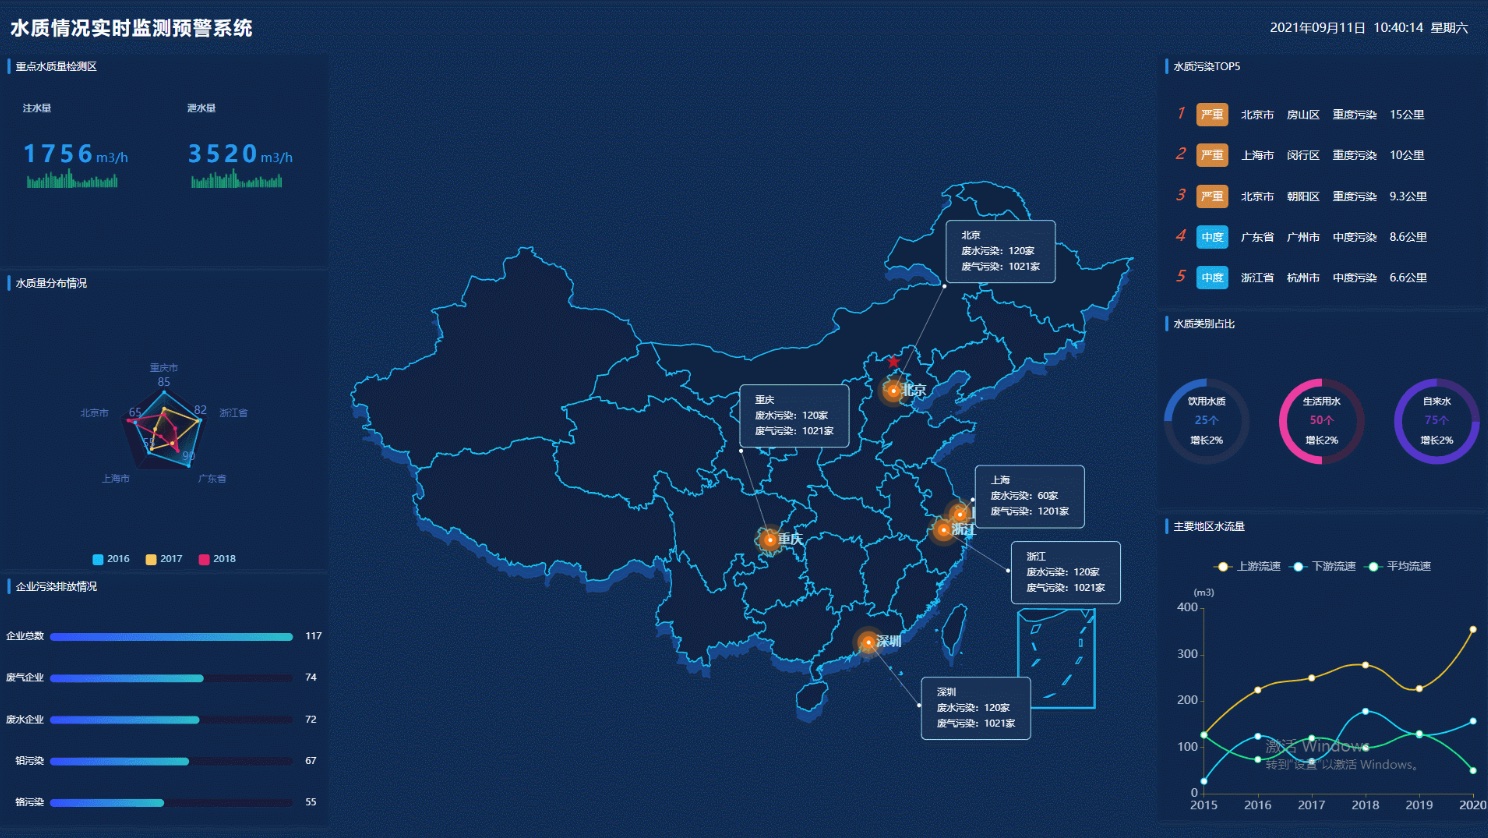
Recently, I was assigned another GIS dashboard project. My manager asked me to research the mainstream design styles currently on the market. Coincidentally, I had previously introduced a collection of such dashboard works in an article titled "Open-Source Dashboard Templates for GIS Developers: BigDataView Project". Combined with various examples shared within our community group, I managed to complete the task.

During the research process, I noticed an interesting phenomenon: many dashboards still use maps in the EPSG:3857 projection, which results in a "tilted" depiction of China's map. Therefore, using OpenLayers and Leaflet as examples, and with the help of various AI tools, I created two demos to implement the rendering of the Albers projection on the web.

more >>

Implementing Lightweight Choropleth Mapping with Colormap.js

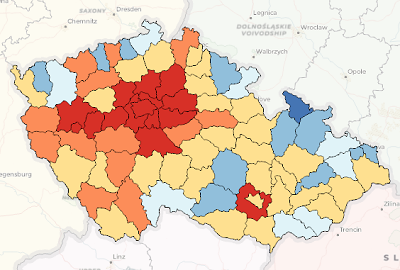
When creating thematic maps in ArcGIS or QGIS, thematic coloring (choropleth mapping) is a common technique where different regions are colored according to their data values, revealing spatial patterns. Recently, our management requested integrating this functionality into our business system. While we could publish pre-rendered maps from ArcGIS/QGIS through servers like GeoServer, this lightweight feature doesn't warrant heavy infrastructure. Instead, I explored coloring GeoJSON features directly and discovered colormap - an elegant solution.

more >>

Decoding the Color-Changing Leaflet Logo: CSS Filter Magic

Yesterday in a technical group, an interesting question arose: How does Leaflet's official website achieve its smooth leaf logo color transition? While initially assuming it was a GIF animation, closer inspection revealed a more elegant solution.

more >>

Copyright © 2020-2025 MalaGIS Drive by Typecho & Lingonberry Sitemap

Back to top