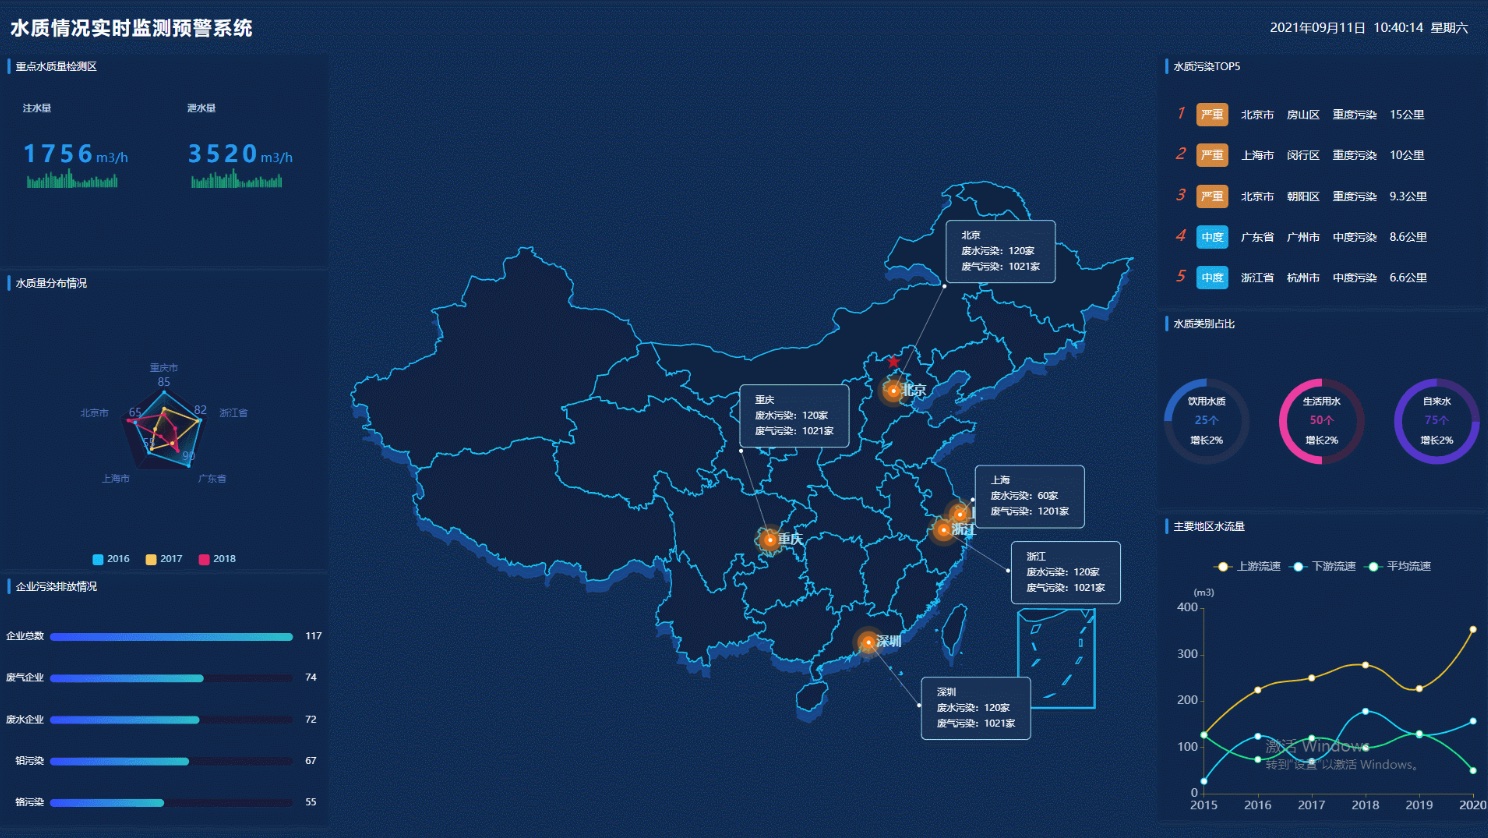
Recently, I was assigned another GIS dashboard project. My manager asked me to research the mainstream design styles currently on the market. Coincidentally, I had previously introduced a collection of such dashboard works in an article titled "Open-Source Dashboard Templates for GIS Developers: BigDataView Project". Combined with various examples shared within our community group, I managed to complete the task.
During the research process, I noticed an interesting phenomenon: many dashboards still use maps in the EPSG:3857 projection, which results in a "tilted" depiction of China's map. Therefore, using OpenLayers and Leaflet as examples, and with the help of various AI tools, I created two demos to implement the rendering of the Albers projection on the web.

Implementation in OpenLayers
For implementing web map rendering with a custom projection, OpenLayers is my top recommendation. It natively supports projection transformations and offers comprehensive functionality.
First, include the dependency libraries:
<link rel="stylesheet" href="https://cdn.jsdelivr.net/npm/ol/ol.css">
<!-- OpenLayers -->
<script src="https://cdn.jsdelivr.net/npm/ol/dist/ol.js"></script>
<!-- Proj4 -->
<script src="https://cdn.jsdelivr.net/npm/proj4@2.8.0/dist/proj4.js"></script>
<script type="module" src="https://cdn.jsdelivr.net/npm/ol/proj/proj4.js"></script>
Note: The proj4 reference must include the type="module" attribute; otherwise, the browser will throw an error.
The core JavaScript code is as follows:
// Register a custom Albers projection
proj4.defs("EPSG:100001",
  "+proj=aea +lat_1=25 +lat_2=47 +lat_0=30 +lon_0=105 +x_0=0 +y_0=0 +datum=WGS84 +units=m +no_defs"
);
ol.proj.proj4.register(proj4);

const albersProjection = ol.proj.get("EPSG:100001");

// Set an extent for the projection to facilitate OL positioning
albersProjection.setExtent([-3000000, -2000000, 3000000, 3000000]);

// Create a rectangular Polygon (China's extent in lat/lon) and project it to Albers
const feature = new ol.Feature({
  geometry: ol.geom.Polygon.fromExtent([73, 18, 135, 53]) // roughly China bbox in EPSG:4326
});
feature.getGeometry().transform("EPSG:4326", "EPSG:100001");

const vectorLayer = new ol.layer.Vector({
  source: new ol.source.Vector({
    url: "province.geojson", // Your GeoJSON path
    format: new ol.format.GeoJSON({
      dataProjection: "EPSG:4326",       // Source data is in WGS84
      featureProjection: "EPSG:100001"   // Transform to custom projection
    })
  }),
  style: new ol.style.Style({
    stroke: new ol.style.Stroke({ color: "red", width: 2 }),
    fill: new ol.style.Fill({ color: "rgba(255,0,0,0.1)" })
  })
});

const map = new ol.Map({
  target: "map",
  layers: [vectorLayer],
  view: new ol.View({
    projection: albersProjection,
    center: ol.proj.fromLonLat([105, 35], albersProjection),
    zoom: 3
  })
});
The running effect is shown in the figure below:

It can also be combined with the tools from the previous article "Implementing Lightweight Choropleth Mapping with Colormap.js" to achieve color grading.

Implementation in Leaflet
The implementation in Leaflet is similar, requiring the use of the third-party library module Proj4Leaflet. The simplified code is as follows:
First, include the dependency resources:
<link rel="stylesheet" href="https://unpkg.com/leaflet/dist/leaflet.css" />
<script src="https://unpkg.com/leaflet/dist/leaflet.js"></script>

<!-- Proj4 & Proj4Leaflet -->
<script src="https://cdnjs.cloudflare.com/ajax/libs/proj4js/2.8.0/proj4.js"></script>
<script src="https://cdnjs.cloudflare.com/ajax/libs/proj4leaflet/1.0.2/proj4leaflet.js"></script>
Then manually set the coordinate system and create the map:
// Define the Albers projection (proj4 format)
var albersProj4 = "+proj=aea +lat_1=25 +lat_2=47 +lat_0=30 +lon_0=105 +x_0=0 +y_0=0 +datum=WGS84 +units=m +no_defs";

// Create a custom CRS
var customCRS = new L.Proj.CRS("EPSG:100001", albersProj4, {
  // Manually set the extent (here, a sufficiently large range is given arbitrarily)
  bounds: L.bounds([-4000000, -2000000], [4000000, 4000000]),
  resolutions: [
    8192, 4096, 2048, 1024, 512, 256, 128, 64, 32, 16, 8, 4, 2, 1
  ]
});

// Create the map
var map = L.map("map", {
  crs: customCRS,
  center: [35, 105],  // Approximate center of China (will be projected and transformed)
  zoom: 2
});

// Load GeoJSON (WGS84 coordinates)
fetch("province.geojson")
  .then(response => response.json())
  .then(data => {
    var geojsonLayer = L.geoJson(data, {
      style: {
        color: "blue",
        weight: 1,
        fillColor: "rgba(0,0,255,0.1)",
        fillOpacity: 0.5
      }
    }).addTo(map);

    map.fitBounds(geojsonLayer.getBounds());
  });
The effect is shown in the figure:

GeoJSON Data
The test data used in this article comes from "Updated 2024 Administrative Division Data with Official Approval Number GS(2024)0650". Those in need can download it themselves.
Unfinished Work
Although we have rendered GeoJSON data in a custom projection using the capabilities of front-end map frameworks, the base map data has not yet been reprojected. Therefore, the effect diagrams shown in this article do not include a base map. If your requirements also involve loading a base map for matching, consider starting a WMS/WMTS service to reproject the base map to Albers (for example, by setting up your own GeoServer).
All Source Code
The source code used for testing in this article is hosted on GitHub. Those in need can refer to:
