Valentine’s Day is here again, and the GIS community group at Malagis is buzzing with excitement. Watching the lively discussions makes one nostalgic for youthful enthusiasm. On such a romantic day, shouldn't everything—including GIS—have its own charm? Let’s explore two GIS-inspired romantic ideas shared by the group.
1. The Bonne Projection
Do you still remember the Bonne projection? Or have your cartography lessons faded into memory? Here's what it looks like:
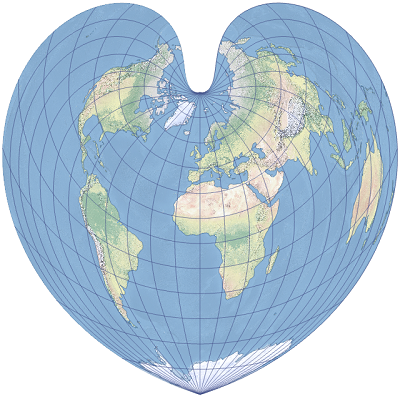
This projection is easy to apply using ArcGIS. However, in QGIS, it's not included by default and didn’t work successfully in several attempts. So, with the help of Gemini, ChatGPT, and DeepSeek, the following WKT definition was generated:
PROJCRS["Bonne_WGS84",
    BASEGEOGCRS["WGS 84",
        DATUM["World Geodetic System 1984",
            ELLIPSOID["WGS 84",6378137,298.257223563,
                LENGTHUNIT["metre",1]],
            ID["EPSG",6326]],
        PRIMEM["Greenwich",0,
            ANGLEUNIT["Degree",0.0174532925199433]]],
    CONVERSION["unnamed",
        METHOD["Bonne",
            ID["EPSG",9827]],
        PARAMETER["latitude_of_origin",45,
            ANGLEUNIT["Degree",0.0174532925199433]],
        PARAMETER["Longitude of natural origin",0,
            ANGLEUNIT["Degree",0.0174532925199433],
            ID["EPSG",8802]]],
    CS[Cartesian,2],
        AXIS["(E)",east,
            ORDER[1],
            LENGTHUNIT["metre",1,
                ID["EPSG",9001]]],
        AXIS["(N)",north,
            ORDER[2],
            LENGTHUNIT["metre",1,
                ID["EPSG",9001]]]]
To use it in QGIS, copy this WKT into a custom projection. You can follow this tutorial: Adding Custom Projections in QGIS. Then load the world vector data from this article: World Map Vector Data by Country (SHP Format), and apply the projection. Here's the result:
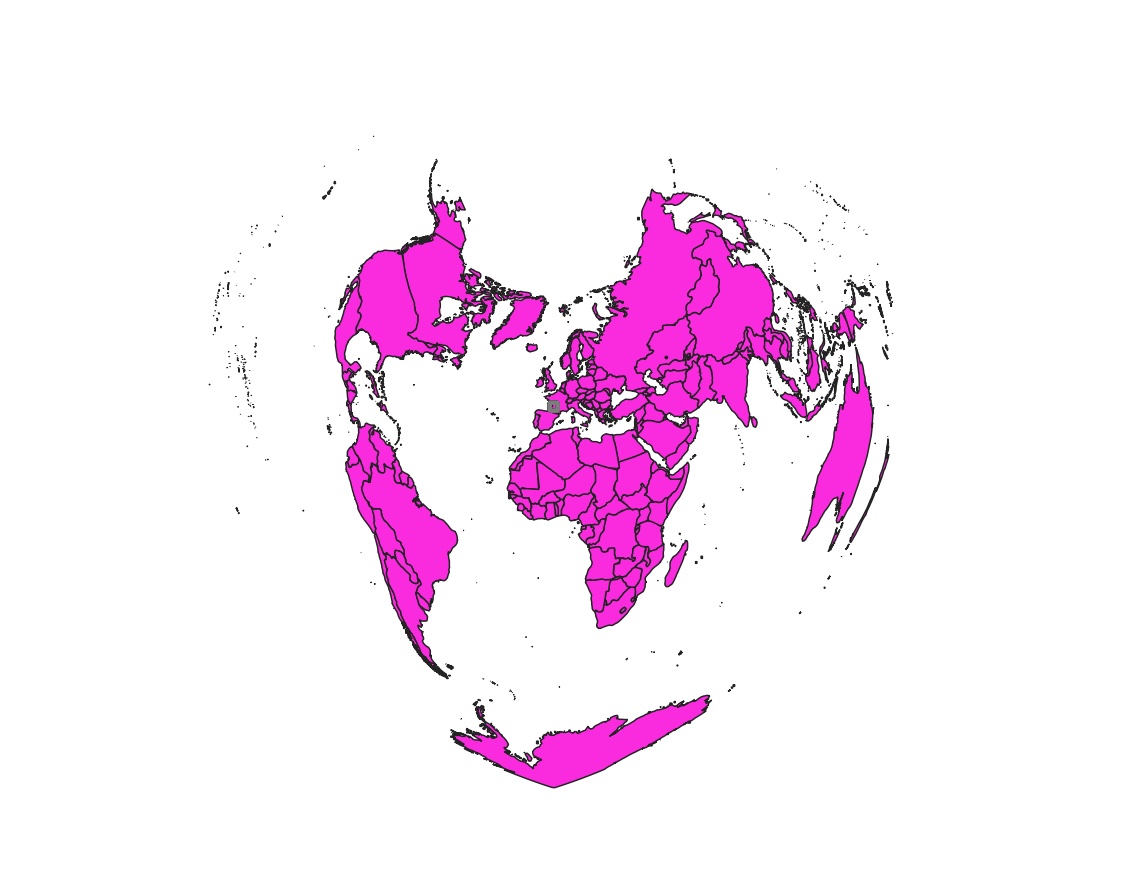
Note: In ArcGIS, using the Bonne projection is easier since it's included by default—no need to manually define the WKT. Feel free to give it a try.
2. Draw a Heart Yourself
As GIS professionals, drawing is a fundamental skill. If you can imagine it, you can create it. Here are two recommended QGIS plugins for freehand drawing:
1. Bezier Editing
As the name suggests, this plugin allows you to draw Bezier curves. After installation, simply create a new line layer and start editing. Here’s a sample demo from the plugin’s page:
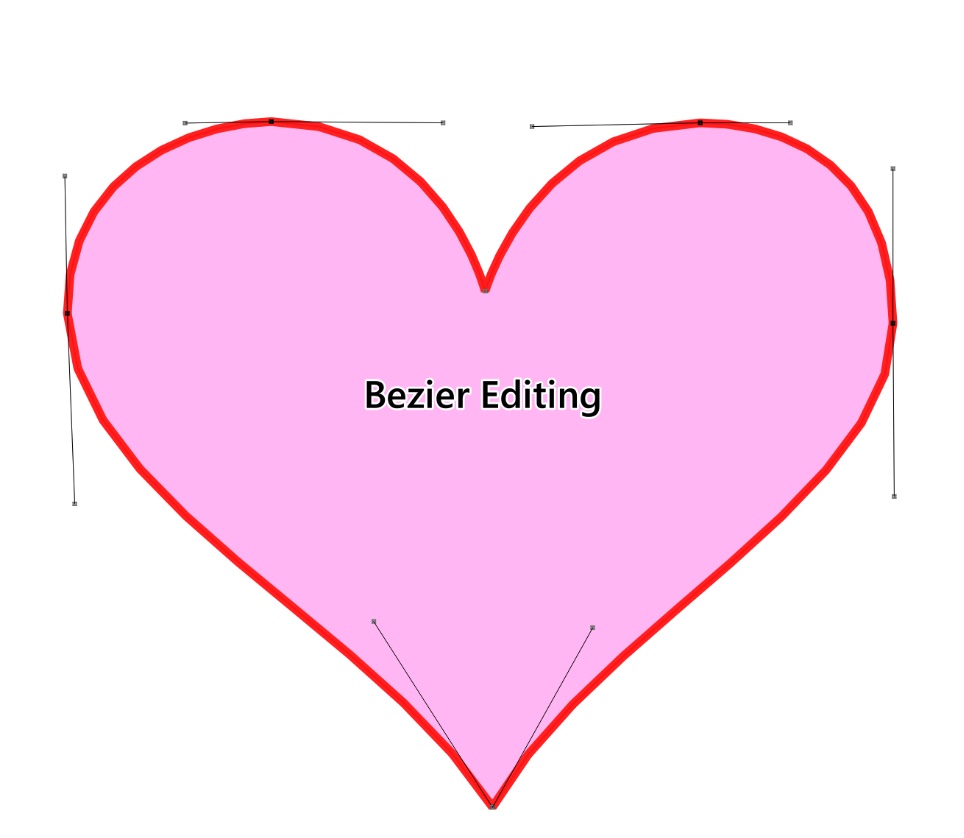
Note: This plugin recommendation came from @小李不讲李 in the Malagis group—thank you for sharing!
2. Red Layer
This plugin turns QGIS into a sketchpad, allowing you to draw freely by hand. Here's an example of what you can create:

24°50′17.16″N 55°24′17.28″E
A mysterious coordinate. Look it up in Google Earth, and you’ll see this:

Final Words & Disclaimer
This article is purely for fun among GIS enthusiasts. If you use any of these methods to confess your love, the outcome is your own responsibility. If you have more romantic GIS ideas, feel free to share them in the comments!