This article summarizes common Python GDAL code snippets for geospatial data processing. GDAL (Geospatial Data Abstraction Library) is a foundational library for handling raster and vector geospatial data, maintained by the Open Source Geospatial Foundation (OSGeo). Implemented in C/C++, it provides Python, Java, and other language bindings. When calling GDAL's API in Python, the underlying execution relies on compiled C/C++ binaries.
GDAL Official Site: https://gdal.org/
Python API Documentation: https://gdal.org/api/index.html#python-api
2. Development Setup
For demonstration, we'll create a dedicated Conda environment:
bash
Create virtual environment (Python 3.8)
conda create -n gdal-test python=3.8 -c https://mirrors.aliyun.com/anaconda/pkgs/main/ -y
conda activate gdal-test
Install core packages
conda install gdal3.0.2 matplotlib3.5.0 -c https://mirrors.aliyun.com/anaconda/pkgs/main/ -y
Remove environment if needed: conda env remove -n gdal-test
If encountering DLL errors on Windows, install precompiled wheels:
UC Irvine Python Extension Packages: https://www.lfd.uci.edu/~gohlke/pythonlibs/#gdal
bash
conda uninstall gdal
pip install GDAL‑3.3.3‑cp38‑cp38‑win_amd64.whl # Path to downloaded file
3. Core Workflows
3.1 Reading GeoTIFF Files
Preview: 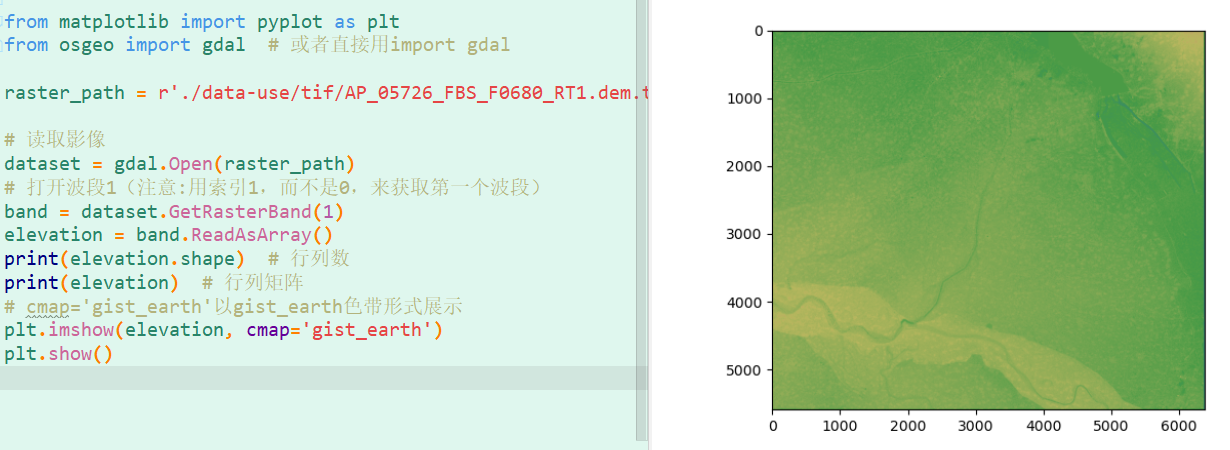
Code:
python
from osgeo import gdal
import matplotlib.pyplot as plt
raster_path = './data-use/tif/AP_05726_FBS_F0680_RT1.dem.tif'
dataset = gdal.Open(raster_path)
band = dataset.GetRasterBand(1)
elevation = band.ReadAsArray()
print("Shape:", elevation.shape)
print("Data:\n", elevation)
plt.imshow(elevation, cmap='gist_earth')
plt.show()
3.2 Reading HDF Files
Preview: 
Code:
python
from osgeo import gdal, gdalconst
import matplotlib.pyplot as plt
raster_path = 'G:/temp/MOSAIC_TMP_2019249.hdf'
dataset = gdal.Open(raster_path, gdalconst.GA_ReadOnly)
band = dataset.GetRasterBand(1)
data_array = band.ReadAsArray()
plt.title('GDAL HDF Visualization')
plt.imshow(data_array, cmap='rainbow')
plt.colorbar()
plt.savefig("./results/hdf_visualization.png", dpi=300)
plt.show()
3.3 2.5D Terrain Visualization
Preview: 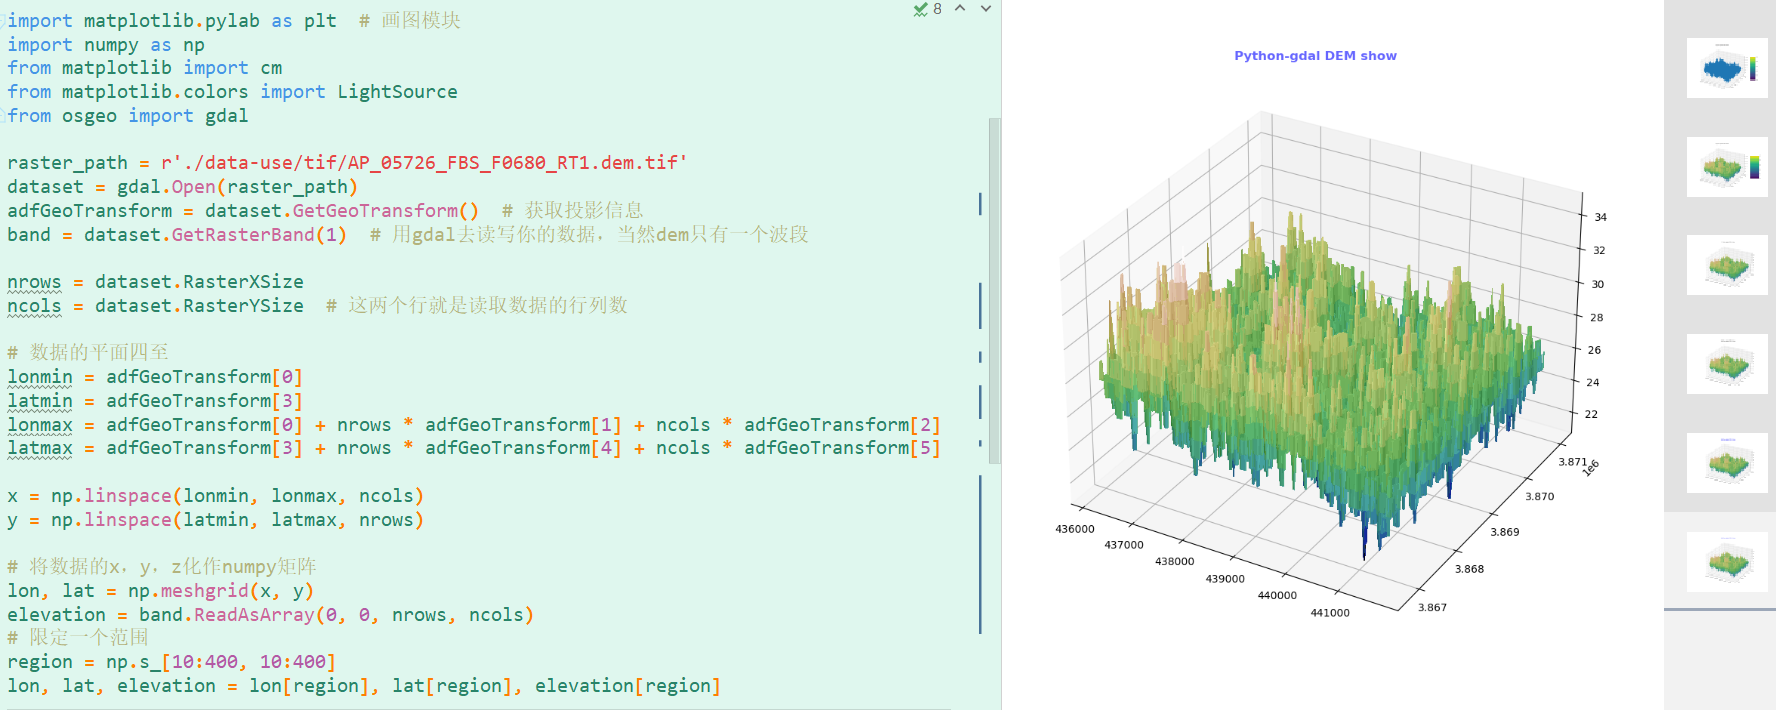
Code:
python
import numpy as np
import matplotlib.pyplot as plt
from osgeo import gdal
from matplotlib import cm
from matplotlib.colors import LightSource
raster_path = './data-use/tif/AP_05726_FBS_F0680_RT1.dem.tif'
dataset = gdal.Open(raster_path)
transform = dataset.GetGeoTransform()
band = dataset.GetRasterBand(1)
Calculate spatial extent
xsize, ysize = dataset.RasterXSize, dataset.RasterYSize
lon_min, lat_max = transform[0], transform[3]
lon_max = lon_min + xsize * transform[1]
lat_min = lat_max + ysize * transform[5]
Create coordinate grids
x = np.linspace(lon_min, lon_max, xsize)
y = np.linspace(lat_min, lat_max, ysize)
lon, lat = np.meshgrid(x, y)
elevation = band.ReadAsArray()
Subset for performance
region = np.s_[10:400, 10:400]
lon, lat, elevation = lon[region], lat[region], elevation[region]
3D visualization
fig = plt.figure(figsize=(12, 10))
ax = fig.add_subplot(111, projection='3d')
ls = LightSource(azdeg=270, altdeg=60)
rgb = ls.shade(elevation, cmap=cm.gist_earth, vert_exag=0.1, blend_mode='soft')
surf = ax.plot_surface(lon, lat, elevation, rstride=1, cstride=1,
facecolors=rgb, linewidth=0, antialiased=False)plt.title("Python GDAL DEM Visualization", fontweight='bold', color='#6666FF')
plt.show()
3.4 Extracting Raster Metadata
Key Attributes: 
Code:
python
from osgeo import gdal, osr
import os
def get_raster_metadata(file_path):
if not os.path.exists(file_path):
    raise FileNotFoundError(f"File not found: {file_path}")

dataset = gdal.Open(file_path, gdal.GA_ReadOnly)
if not dataset:
    raise RuntimeError(f"Failed to read file: {file_path}")

# Extract metadata
nodata = dataset.GetRasterBand(1).GetNoDataValue()
cols, rows = dataset.RasterXSize, dataset.RasterYSize
transform = dataset.GetGeoTransform()
projection = osr.SpatialReference()
projection.ImportFromWkt(dataset.GetProjectionRef())
dtype = gdal.GetDataTypeName(dataset.GetRasterBand(1).DataType)

return nodata, cols, rows, transform, projection, dtype
if name == "__main__":
metadata = get_raster_metadata('./data-use/tif/NDVI_201405_bm.tif')
for item in metadata:
    print(item)
Common GDAL Raster Operations: 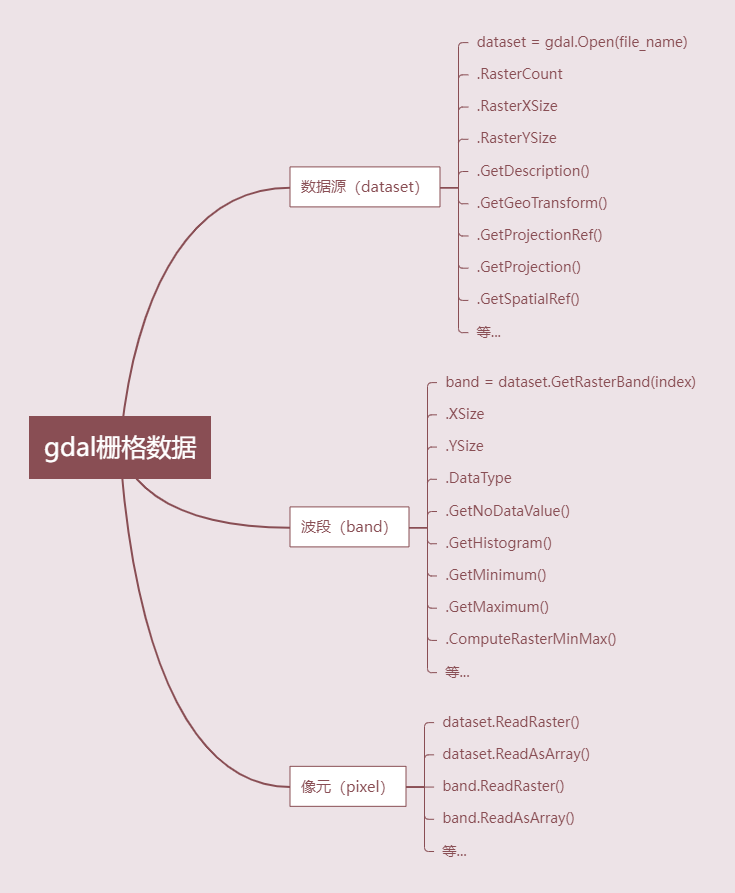
4. Q&A
- Why focus on Python GDAL?
As GIS professionals, desktop tools abstract implementation details. Scripting deepens understanding of geospatial concepts and enables batch processing workflows. Why does this content seem impractical?
"What is the use of a newborn baby?" - Michael Faraday
Skills develop through practice. This foundation enables solving real-world problems through iterative learning.- Why GDAL instead of ArcPy?
While ArcPy is powerful, it requires ArcGIS licensing. GDAL's open-source nature aligns with our philosophy of accessible geospatial tools. Future topics?
Planned workflows:- Format conversion (NetCDF/ASC to GeoTIFF)
- Reprojection
- Raster processing (clipping, resampling, NDVI calculation, cloud removal)
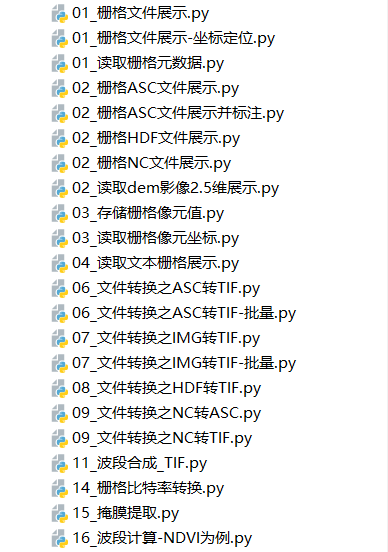
5. Conclusion
All code and sample data are available on Git:
https://gitee.com/fungiser/python-gdal-test
