Red Layer is a sketch annotation plugin for QGIS 3 that enables rapid hand-drawn annotations directly on your map canvas. A sample output is shown below:

Red Layer is a sketch annotation plugin for QGIS 3 that enables rapid hand-drawn annotations directly on your map canvas. A sample output is shown below:
Share a WKT configuration for Bonne projection in QGIS. For those needing to apply Bonne projection in QGIS, this reference may prove useful.
PROJCRS["Bonne_WGS84",
    BASEGEOGCRS["WGS 84",
        DATUM["World Geodetic System 1984",
            ELLIPSOID["WGS 84",6378137,298.257223563,
                LENGTHUNIT["metre",1]],
            ID["EPSG",6326]],
        PRIMEM["Greenwich",0,
            ANGLEUNIT["Degree",0.0174532925199433]]],
    CONVERSION["unnamed",
        METHOD["Bonne",
            ID["EPSG",9827]],
        PARAMETER["latitude_of_origin",45,
            ANGLEUNIT["Degree",0.0174532925199433]],
        PARAMETER["Longitude of natural origin",0,
            ANGLEUNIT["Degree",0.0174532925199433],
            ID["EPSG",8802]]],
    CS[Cartesian,2],
        AXIS["(E)",east,
            ORDER[1],
            LENGTHUNIT["metre",1,
                ID["EPSG",9001]]],
        AXIS["(N)",north,
            ORDER[2],
            LENGTHUNIT["metre",1,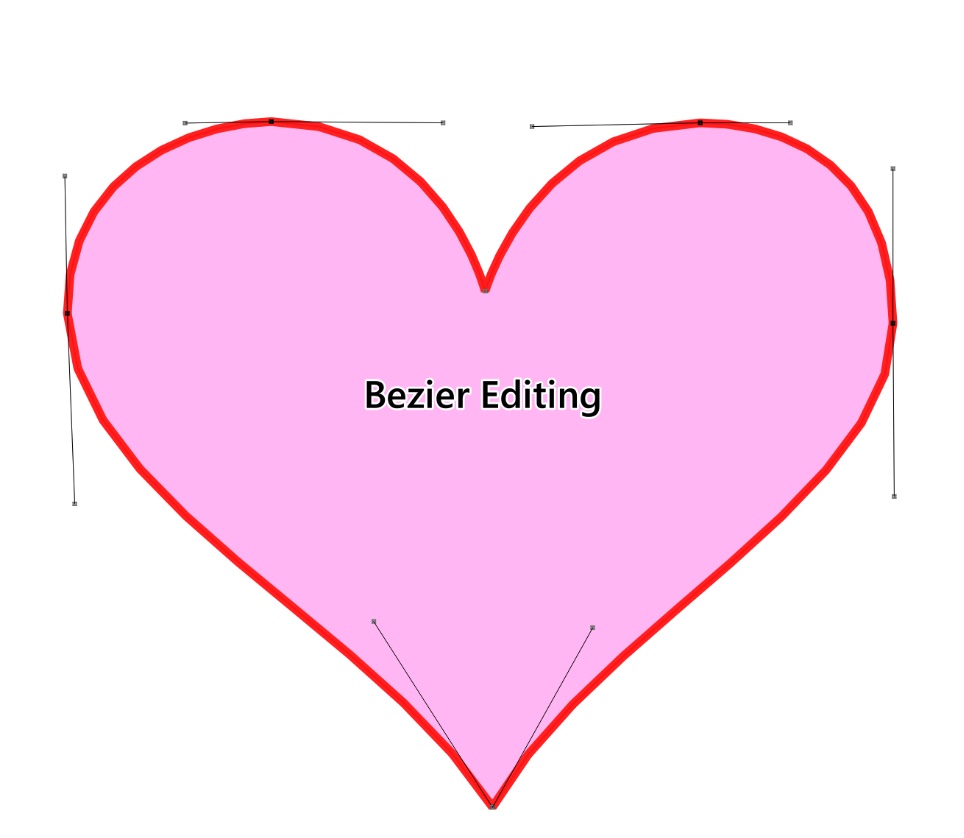
ID["EPSG",9001]]]]Bezier Editing is an open-source plugin for QGIS that specializes in precision vector graphic editing, particularly suited for complex curve design scenarios like roads, rivers, and landscape boundaries. By introducing Bezier curve control points, it transforms rigid polylines into smooth, natural curves, significantly enhancing both cartographic aesthetics and data accuracy.
Valentine’s Day is here again, and the GIS community group at Malagis is buzzing with excitement. Watching the lively discussions makes one nostalgic for youthful enthusiasm. On such a romantic day, shouldn't everything—including GIS—have its own charm? Let’s explore two GIS-inspired romantic ideas shared by the group.
Do you still remember the Bonne projection? Or have your cartography lessons faded into memory? Here's what it looks like:

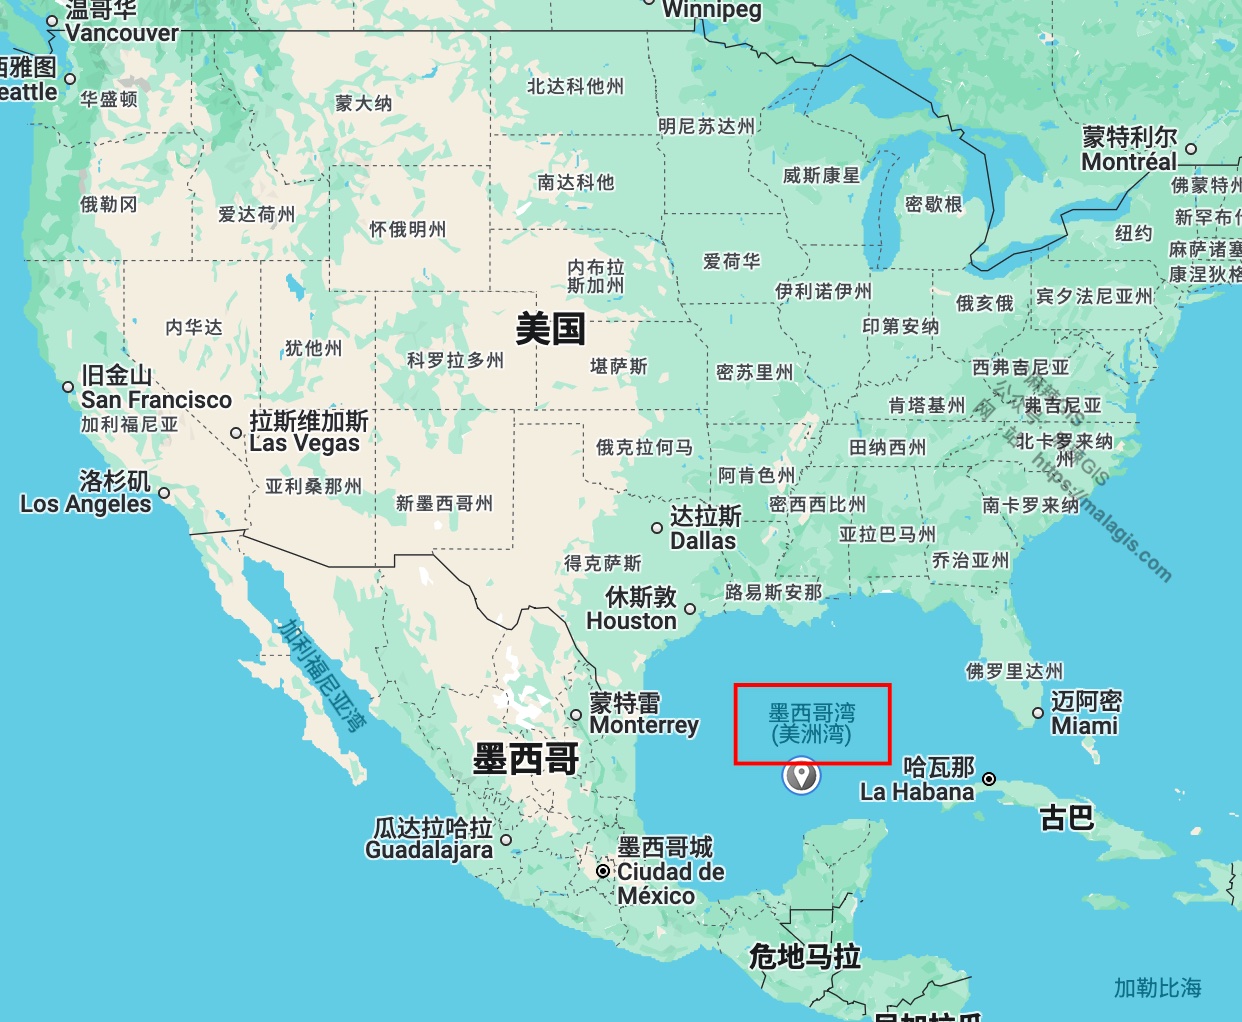
Since U.S. President Donald Trump's executive order on his first day in office renamed the Gulf of Mexico to the "Gulf of America," the ripple effects have begun to spread. Recent reports indicate that major map service providers like Google Maps have already followed suit. But how does this change affect GIS professionals in China, and how should we respond? This article provides a brief analysis.
After reviewing services like Google Maps, Bing Maps, OpenStreetMap, and Cesium, here’s a summary of how each platform is handling the name change.
Google Maps was one of the first to react. Here's how it looks now:
Recently, a screenshot from a Wuhan-based company's website went viral across Chinese social platforms. When I attempted to visit their official site (https://www.focuz-in.com), access was already restricted. However, the internet never forgets—through digital archaeology using the Wayback Machine, I recovered the controversial page:

When visualizing national highway mileage across Chinese provinces in QGIS, I needed provincial capital markers without local data access. Using DeepSeek AI, I generated geographic layers directly in QGIS via Python scripting.
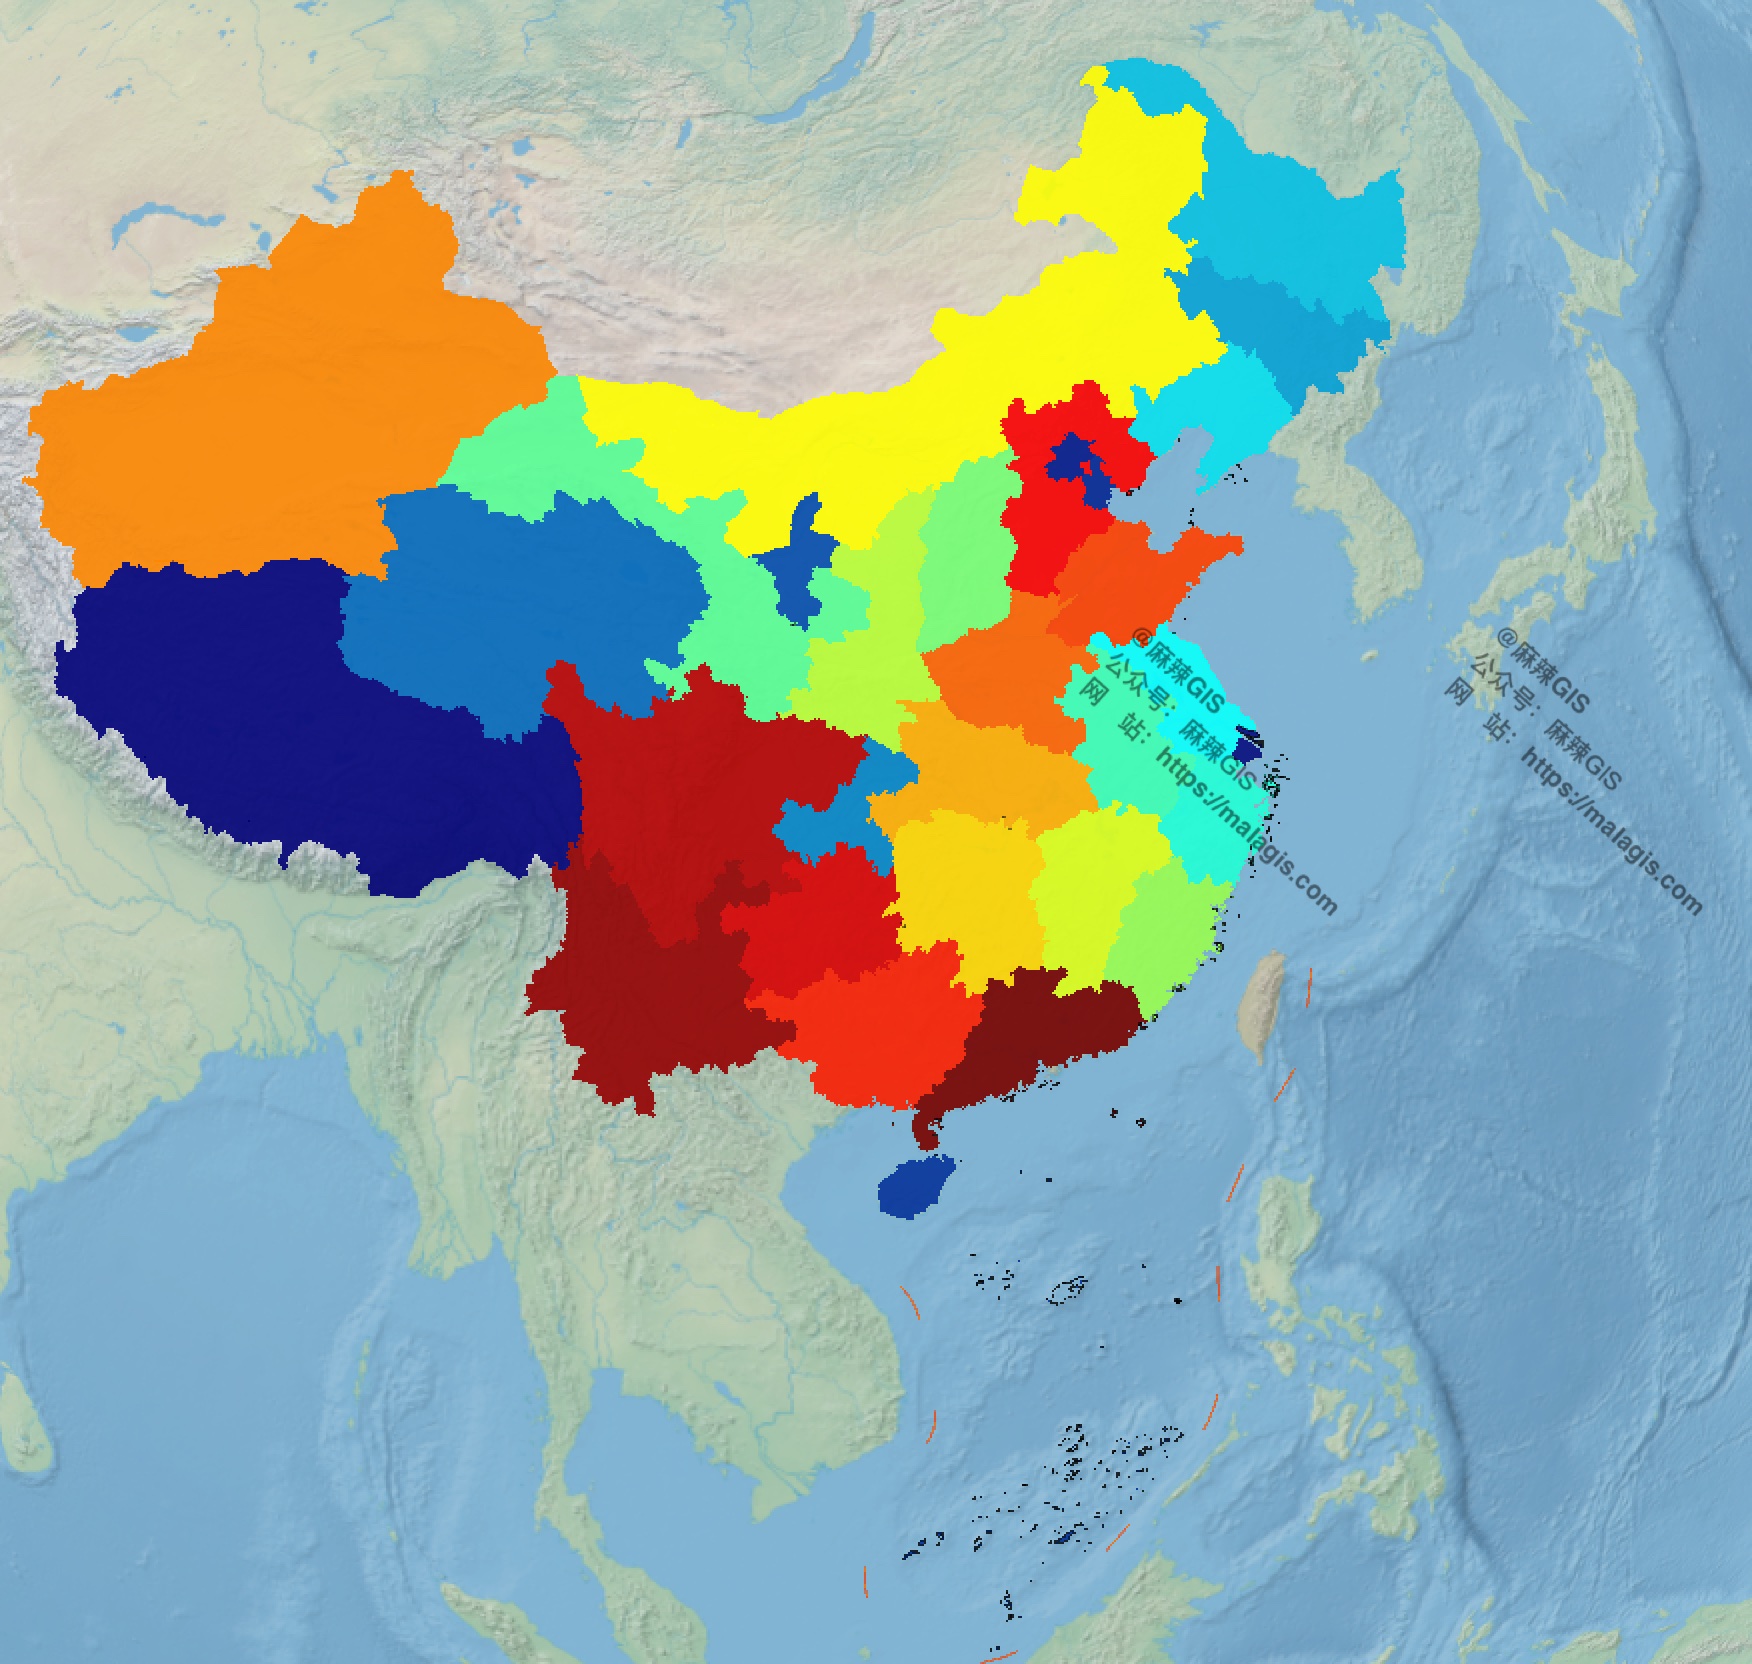
Visualization requiring provincial capitals
Following our guide on https://malagis.com/qucik-build-a-cesium-study-example.html, this article addresses limitations of Cesium Ion—particularly accessibility challenges for Chinese users—by demonstrating alternative basemap integration methods.
The ImageryLayers class manages map imagery display in CesiumJS, enabling:
This article contrasts the core technical specifications of Landsat 9 and Sentinel-2, key Earth observation satellites for environmental monitoring.
Landsat 9
For global-scale visualizations (e.g., GDP distribution maps), complex tile services like WMTS/WMS are often unnecessary. ECharts-GL provides six high-quality static basemaps—including Earth and lunar datasets—that offer lightweight alternatives to conventional tile services. These pre-rendered images work seamlessly with Cesium, Leaflet, and other mapping frameworks.
Complementary resource: https://malagis.com/share-world-map-vector-data-shp-from-gaode-map.html
Copyright © 2020-2026 MalaGIS Drive by Typecho & Lingonberry Sitemap