
 GIS Tutorial
Geospatial Data Harvesting: Using Grok AI to Map Li Ka-shing's Sold Ports for Cesium Visualization
The recent sale of 43 global ports by Li Ka-shing—including two along the Panama Canal—has drawn int...
GIS Tutorial
The recent sale of 43 global ports by Li Ka-shing—including two along the Panama Canal—has drawn int...
 GIS Tutorial
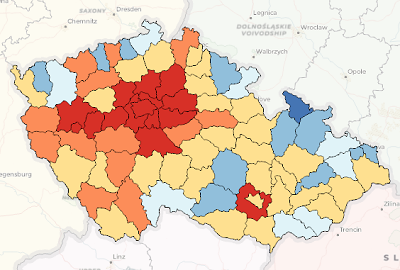
When creating thematic maps in ArcGIS or QGIS, thematic coloring (choropleth mapping) is a common te...
 GIS Tutorial
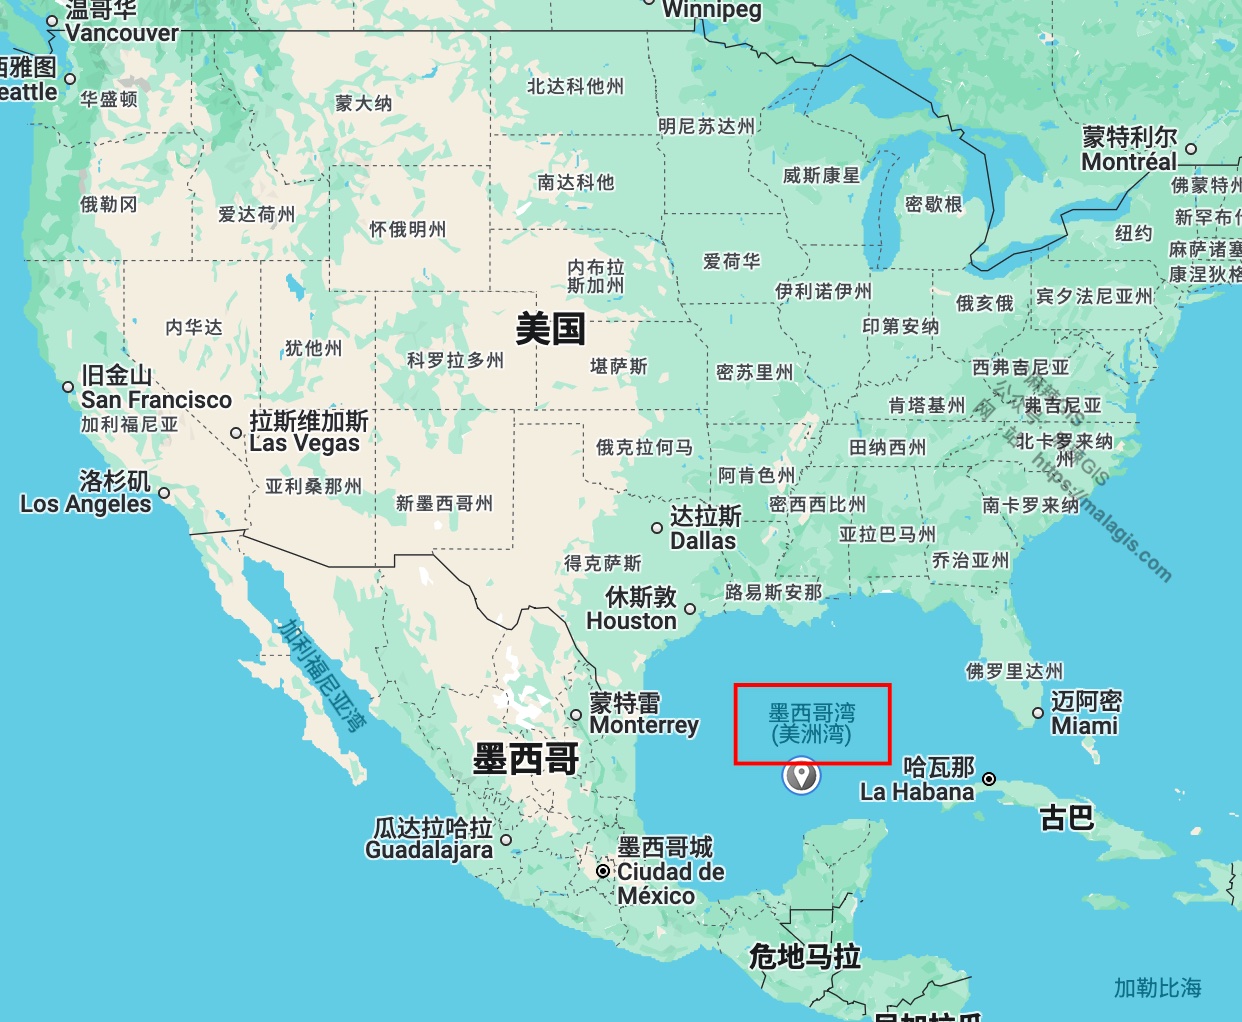
Since U.S. President Donald Trump's executive order on his first day in office renamed the Gulf of M...
Following our guide on https://malagis.com/qucik-build-a-cesium-study-example.html, this article add...
 GIS Tutorial
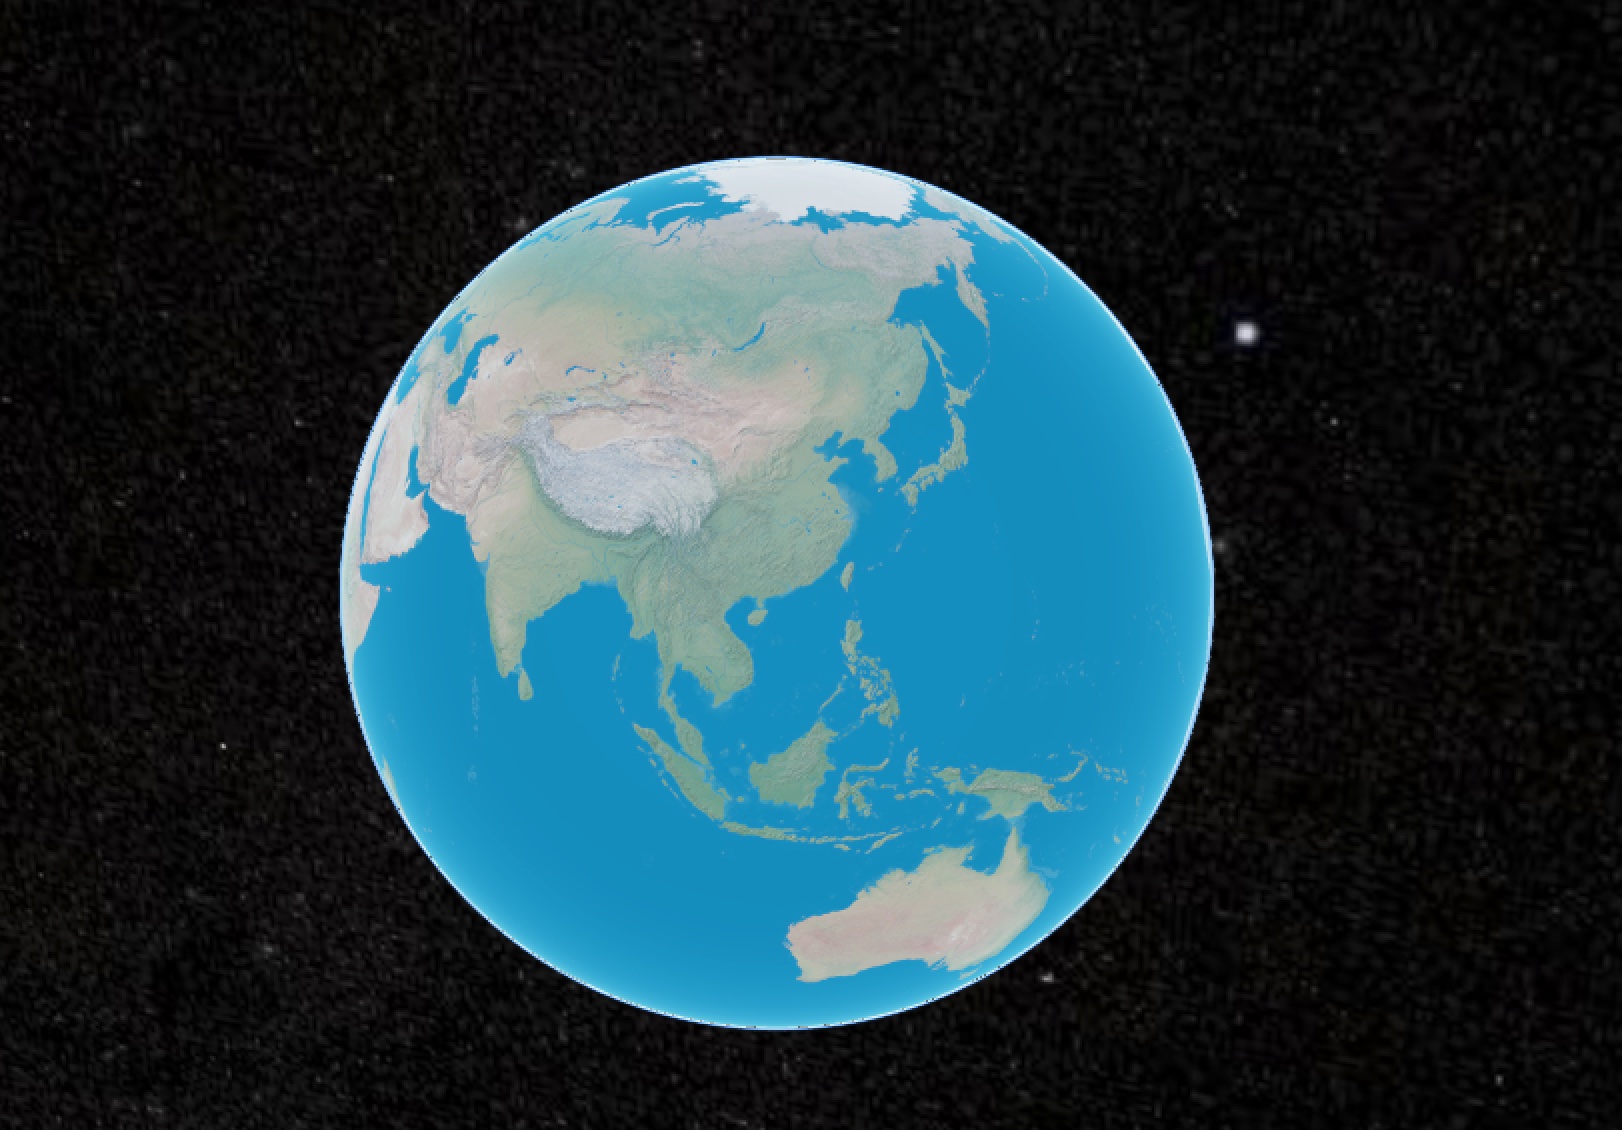
For global-scale visualizations (e.g., GDP distribution maps), complex tile services like WMTS/WMS a...
 GIS Tutorial
When integrating Cesium into a legacy UMI3-based WebGIS project, Node version compatibility issues a...
 GIS Tutorial
When deploying CesiumJS projects, the library's substantial size (~100MB) often slows CI builds. Thi...
 GIS Tutorial
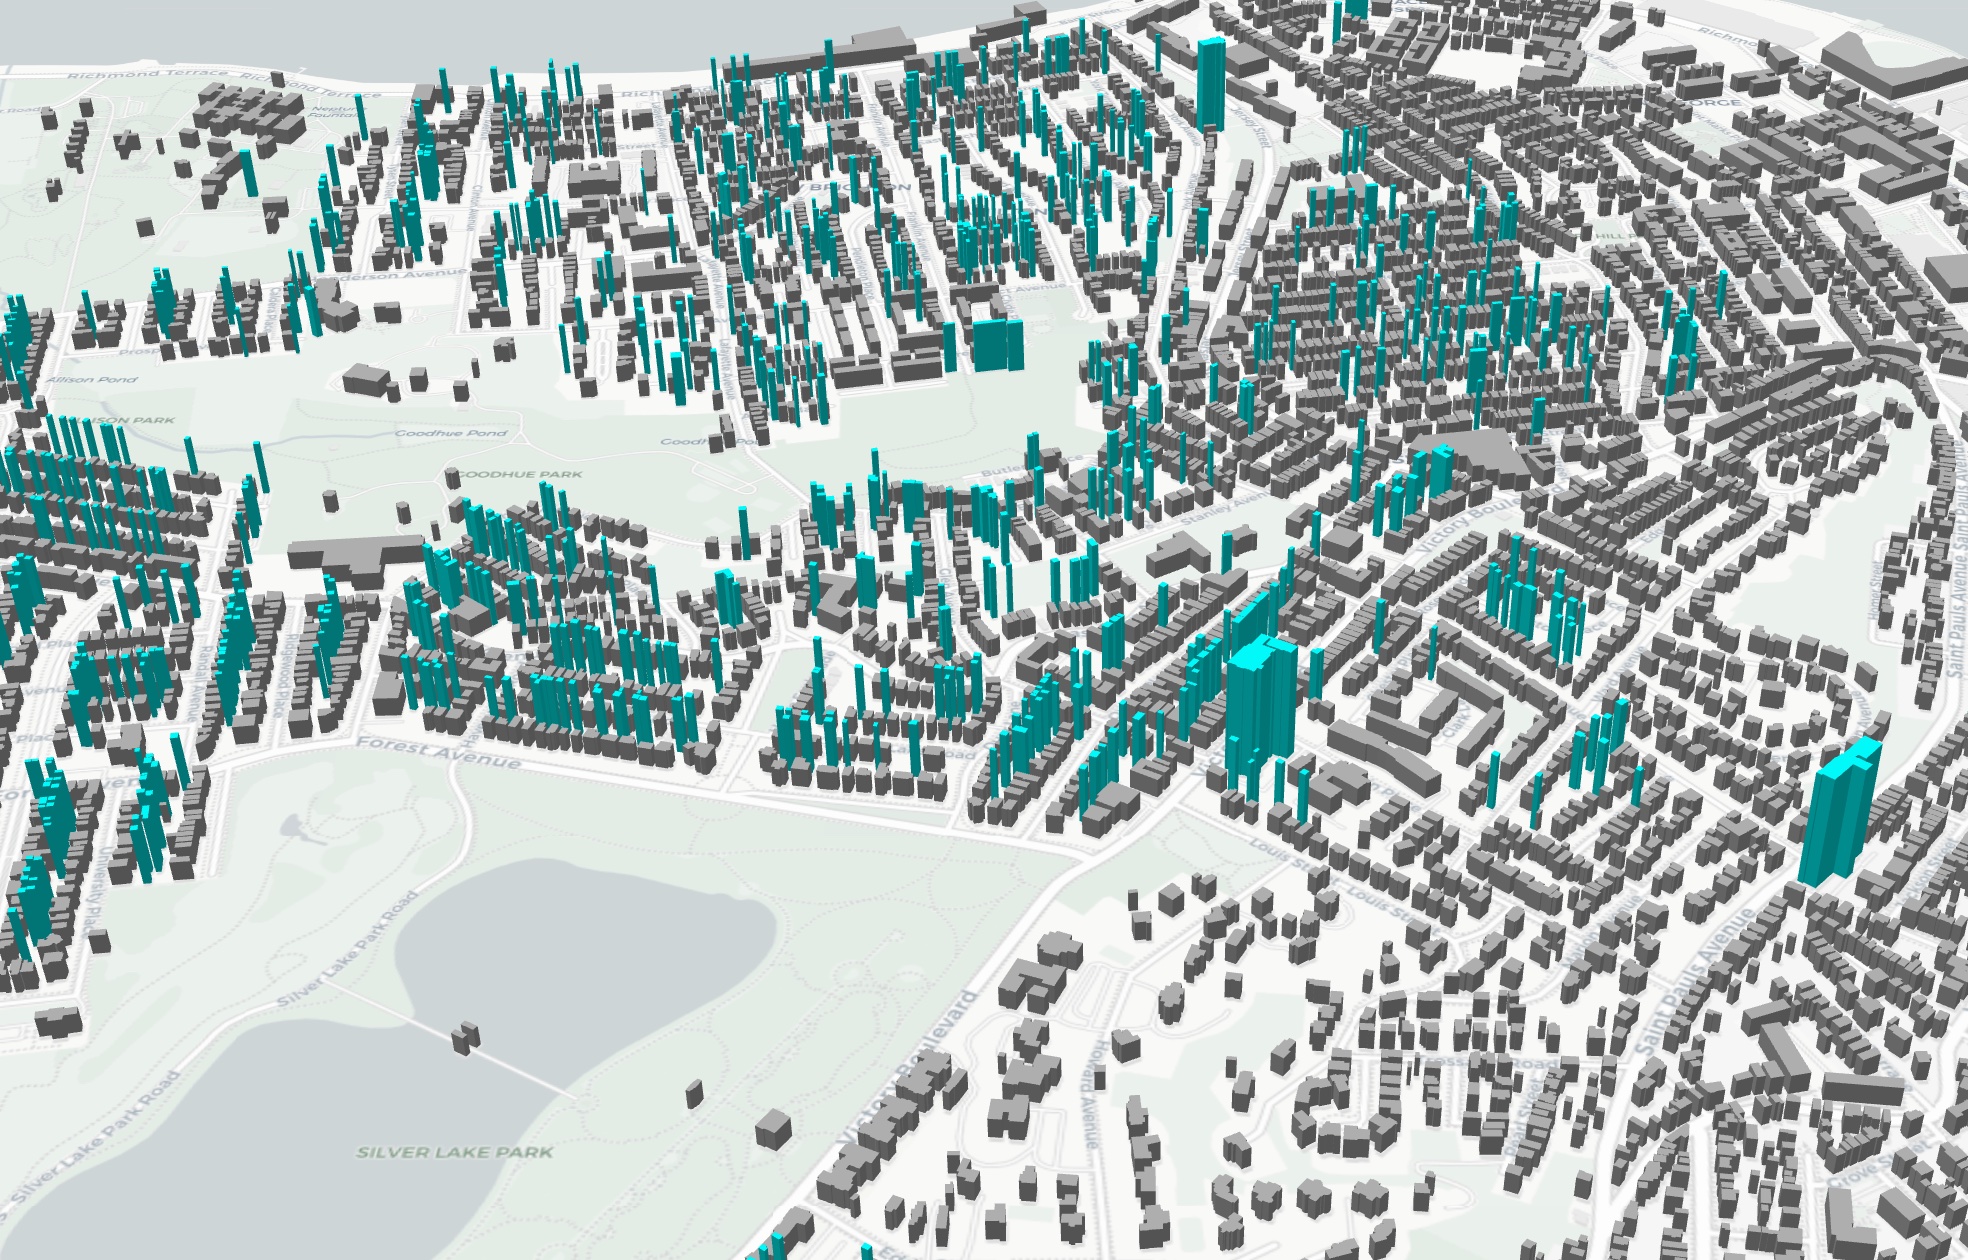
Following Bentley Systems' acquisition of Cesium and its increasing commercial integration, GIS prof...
 GIS Tutorial
As an alternative to the MapPlus solution presented in our previous article 《Creating Dynamic Marath...
Copyright © 2020-2026 MalaGIS Drive by Typecho & Lingonberry Sitemap